Node Red
Node-RED is a programming tool for wiring together hardware devices, APIs and online services in new and interesting ways.
It provides a browser-based editor that makes it easy to wire together flows using the wide range of nodes in the palette that can be deployed to its runtime in a single-click.
 The easiest way to get node-red is via npm. Type in the command lines:
sudo npm install -g --unsafe-perm node-red
To start Node Red run:
node-red
You should now have Node Red running on port 1880
Welcome to Node-RED
===================

25 Jun 22:51:09 - [info] Node-RED version: v0.17.4
25 Jun 22:51:09 - [info] Node.js  version: v6.11.1
25 Jun 22:51:09 - [info] Loading palette nodes
25 Jun 22:51:10 - [warn] ------------------------------------------
25 Jun 22:51:10 - [warn] [rpi-gpio] Info : Ignoring Raspberry Pi specific node
25 Jun 22:51:10 - [warn] ------------------------------------------
25 Jun 22:51:10 - [info] Settings file  : /home/nol/.node-red/settings.js
25 Jun 22:51:10 - [info] User Directory : /home/nol/.node-red
25 Jun 22:51:10 - [info] Server now running at http://127.0.0.1:1880/
25 Jun 22:51:10 - [info] Creating new flows file : flows_noltop.json
25 Jun 22:51:10 - [info] Starting flows
25 Jun 22:51:10 - [info] Started flows
open up chrome, and navigate to http://127.0.0.1:1880/
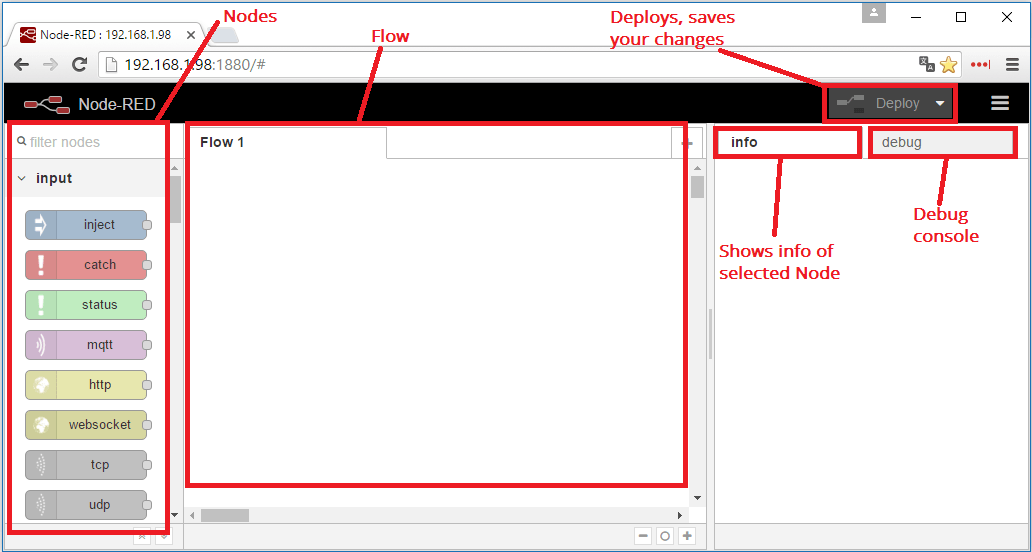
You should see the interface for node red. On the left panel, you’ll find “nodes”, which are predefined function that we can connect together for our program. The center panel is where you’ll develop you program, and the right panel is various options and debuggers.
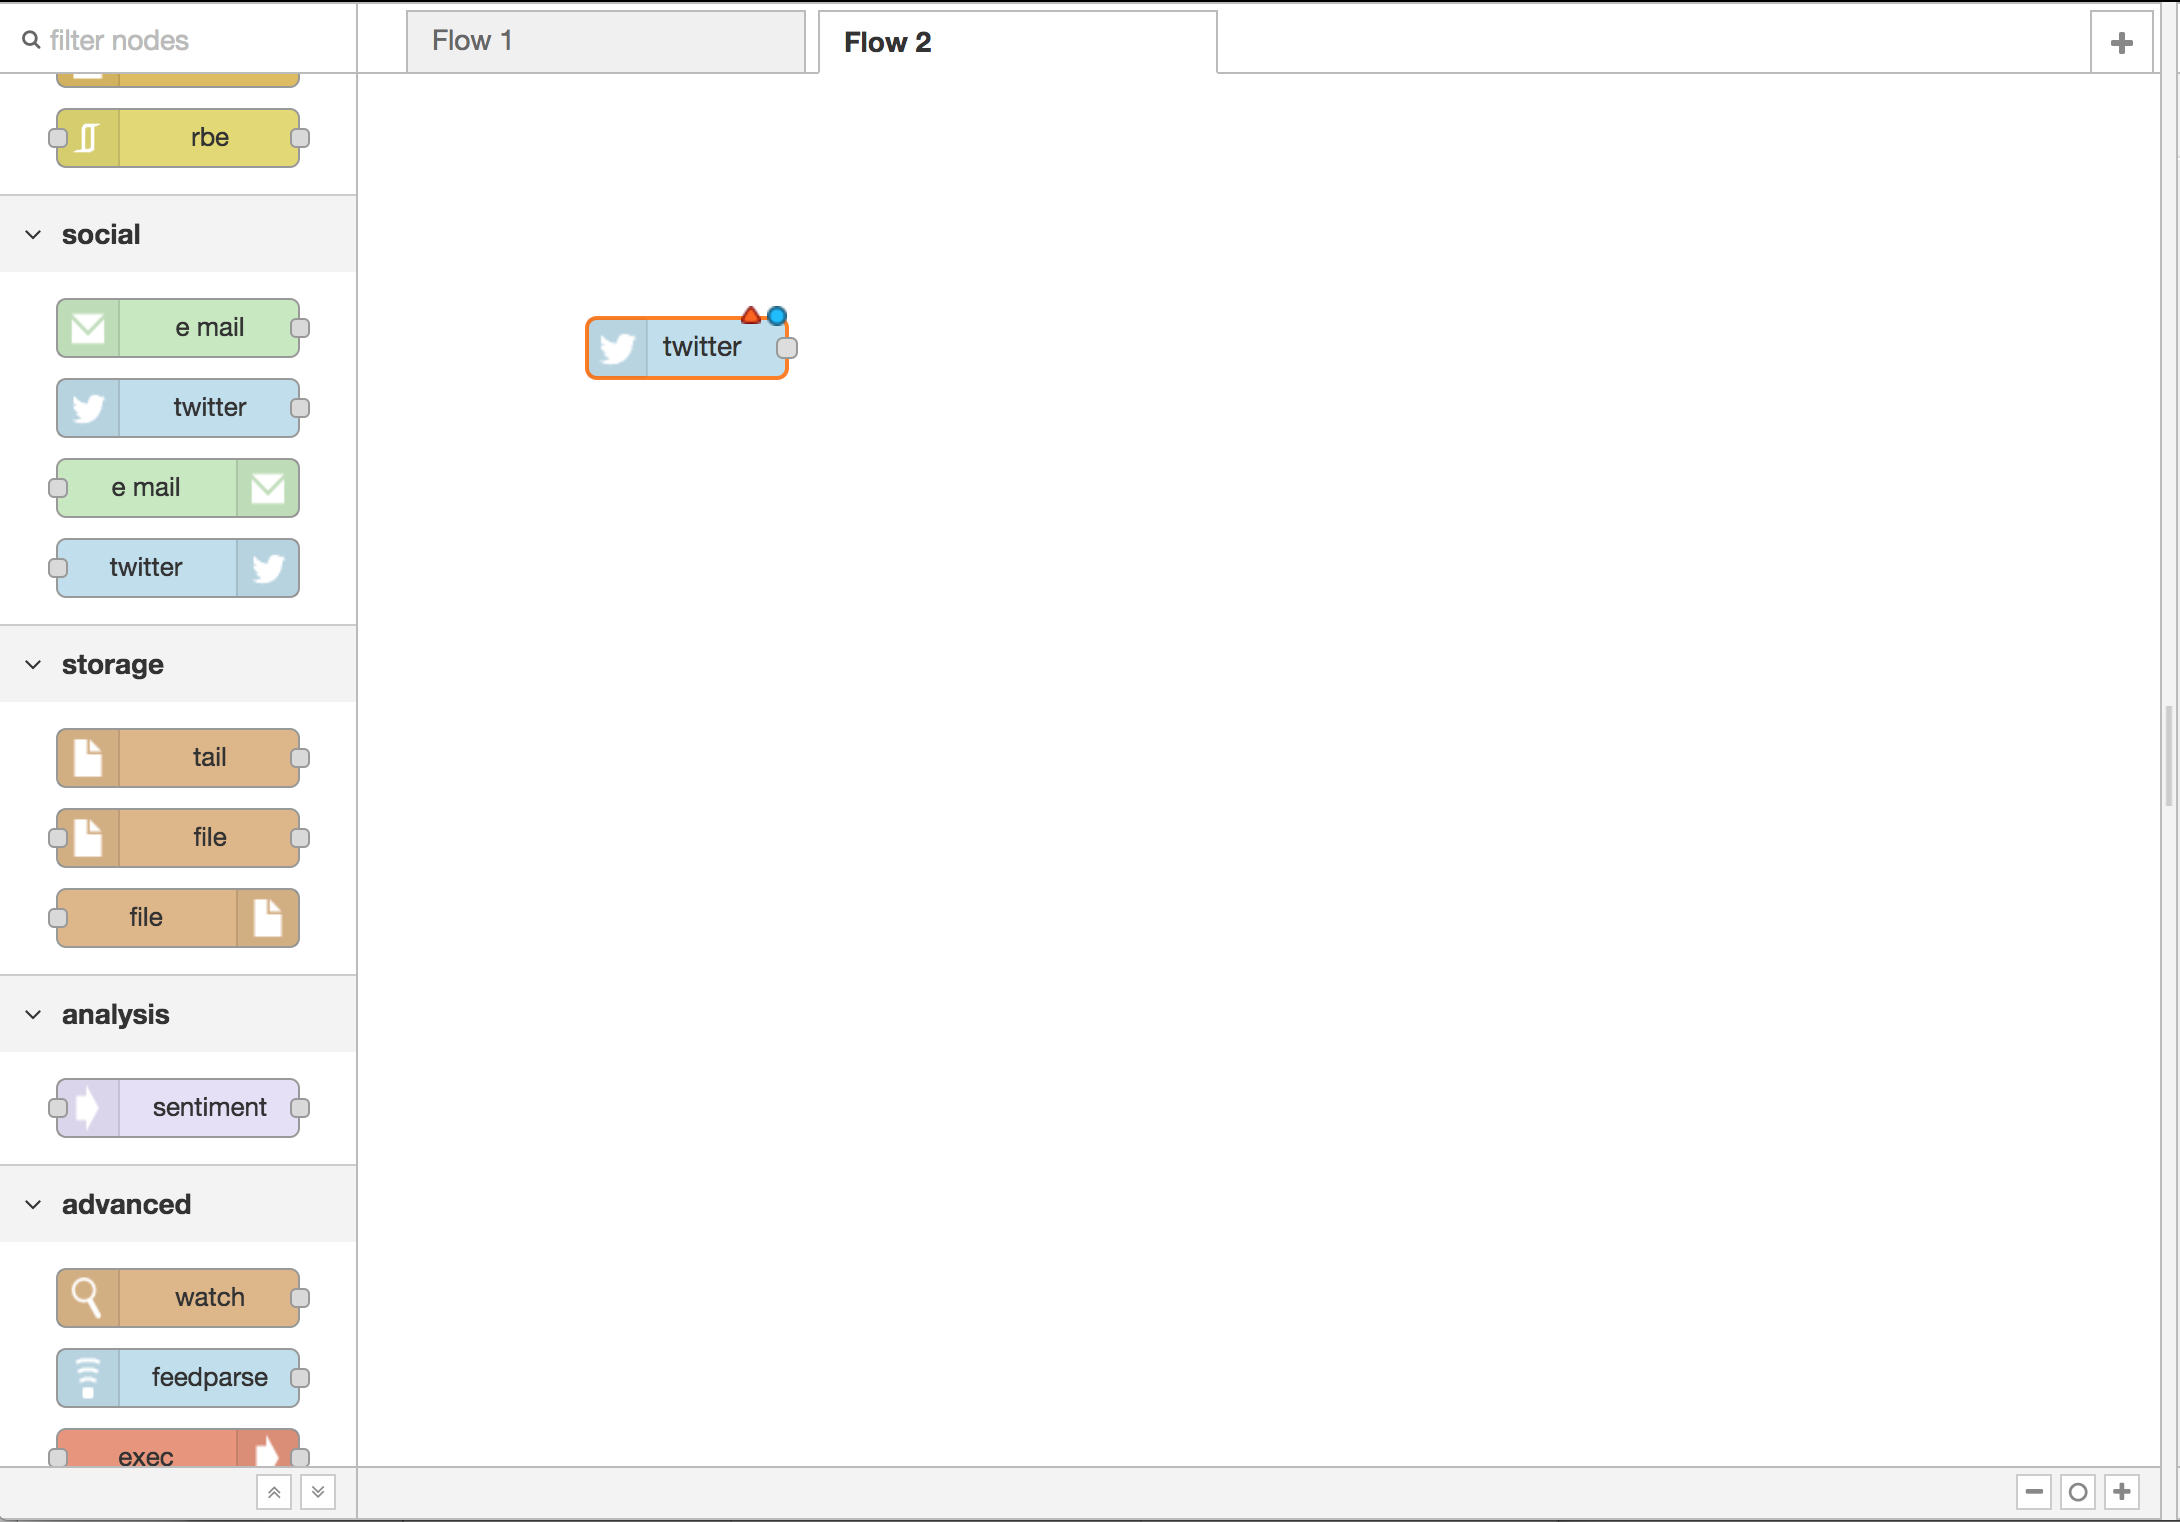
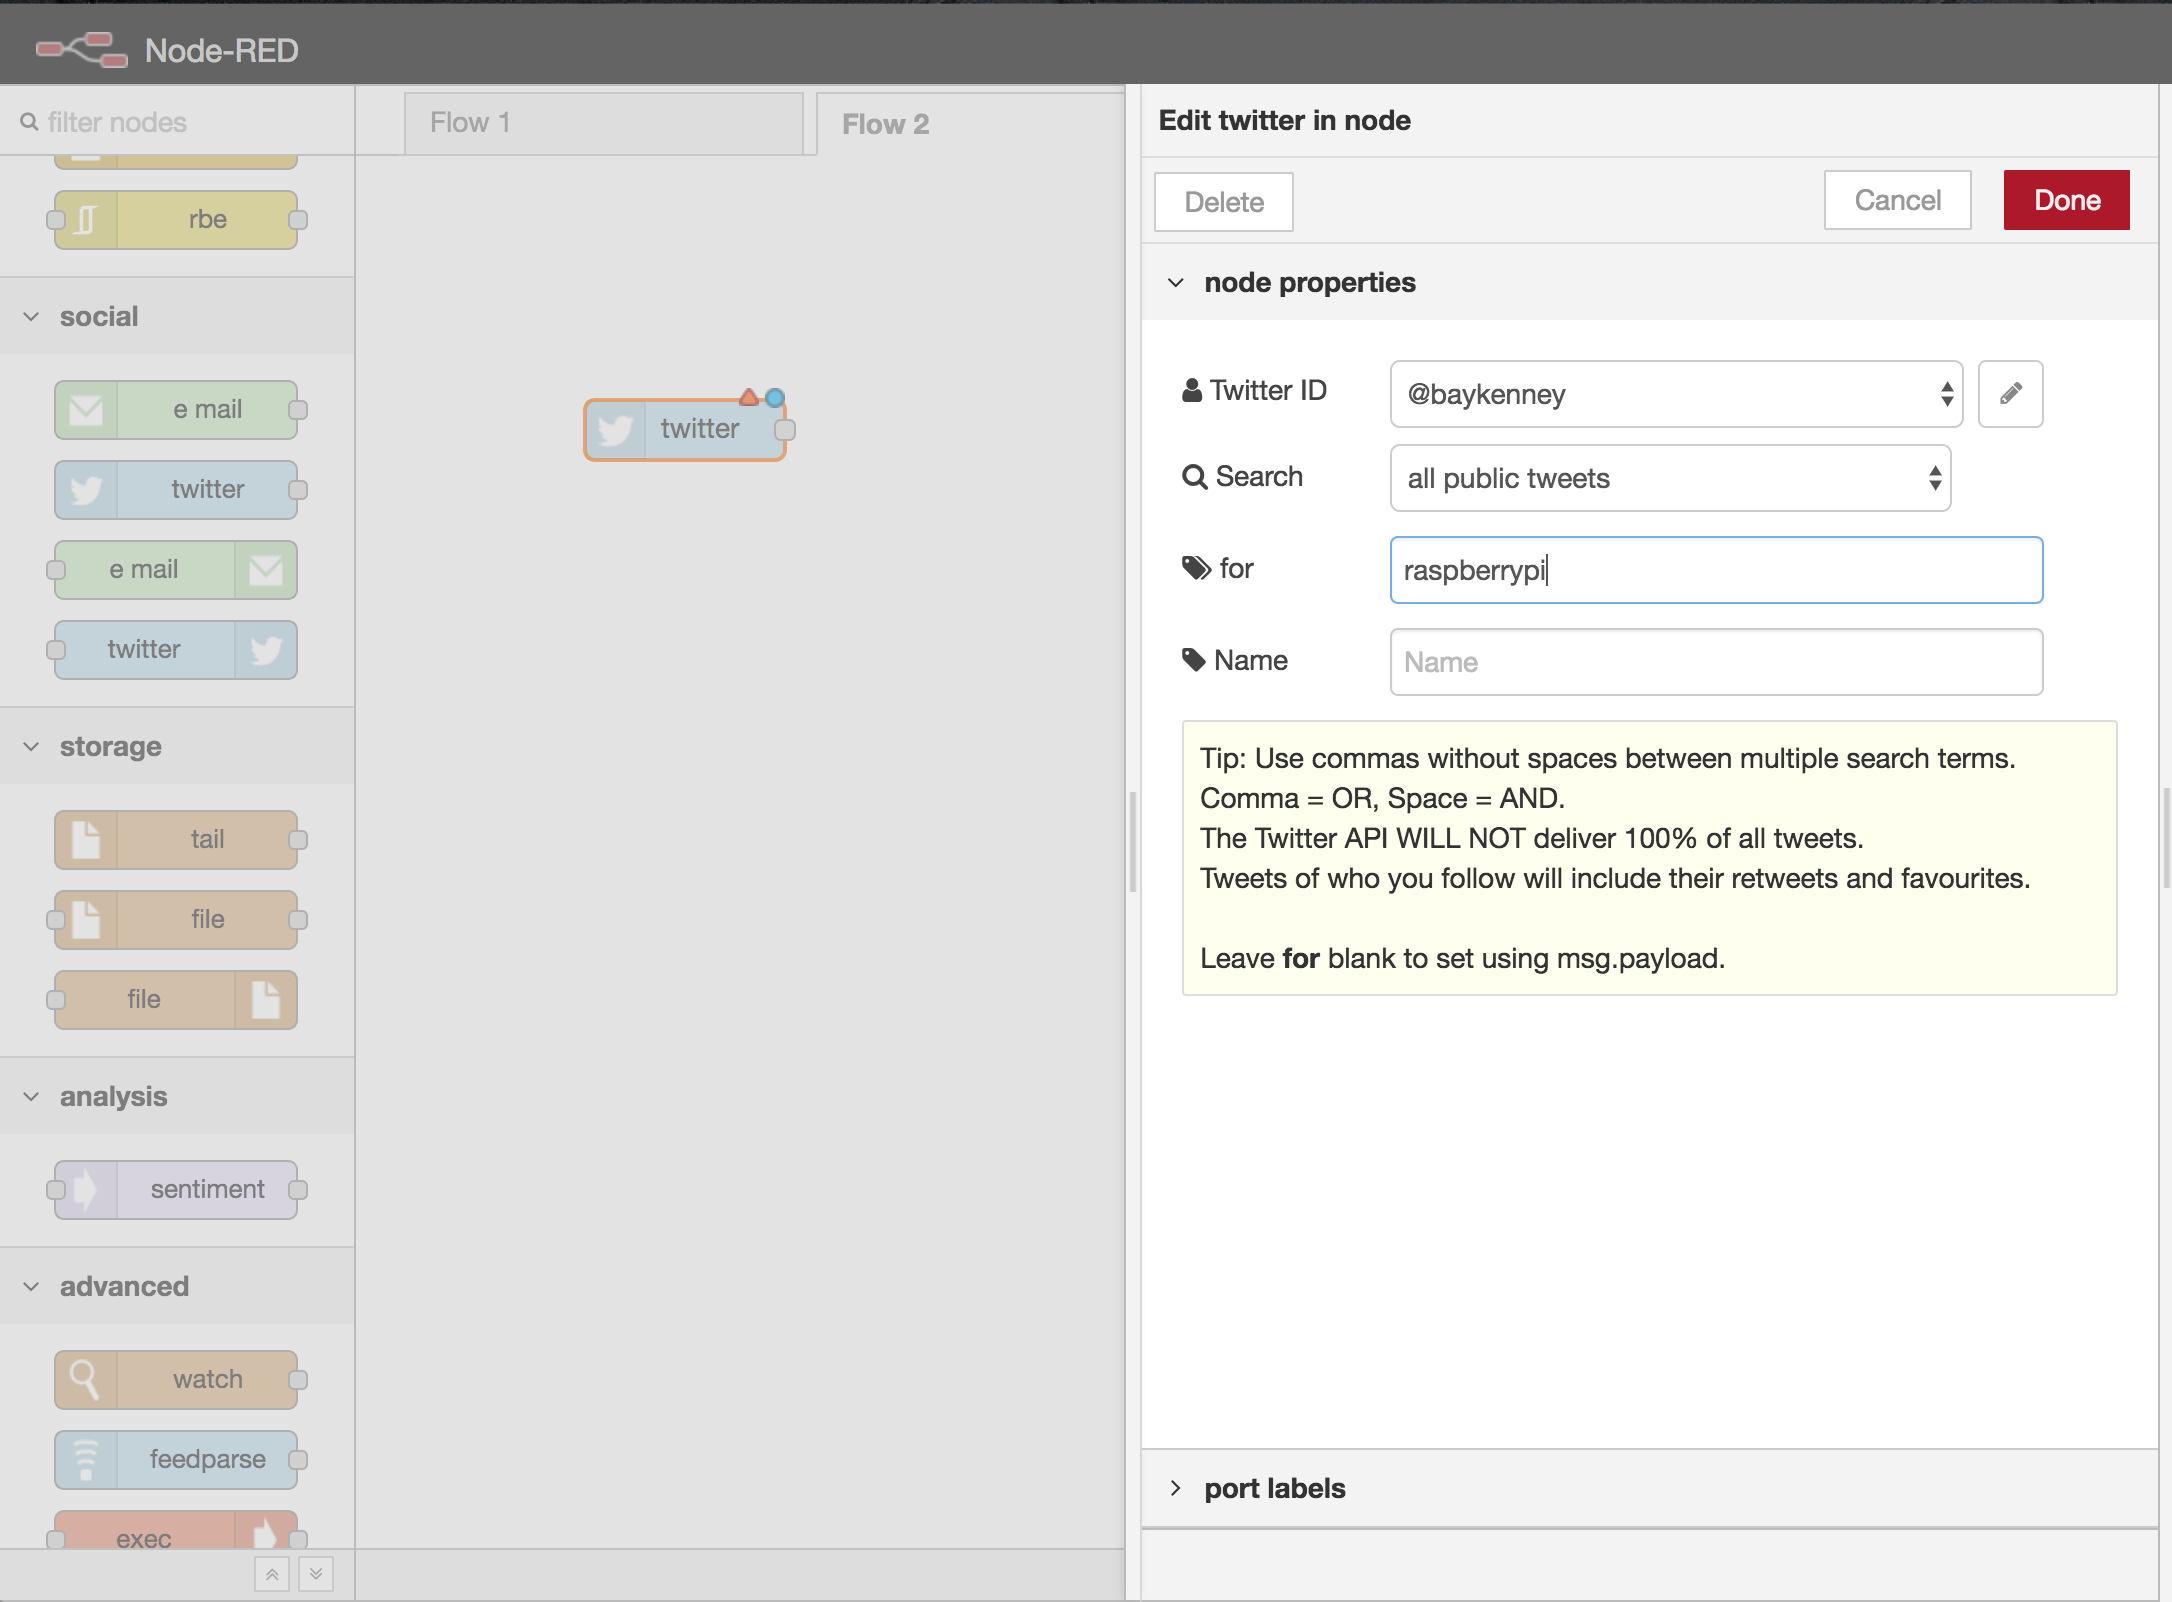
The first node that we’ll use is the twitter node. This allows us to connect our twitter accounts to node red and use the twitter API to pull in tweets.
You can see that there is an orange triangle at the top of out twitter node. This tells us that we have some more setup to do before we can deploy our script
If we double click on the twitter node, a side panel will appear that will let us hook into thier API. Click the pencil to connect to your twitter account to the API.
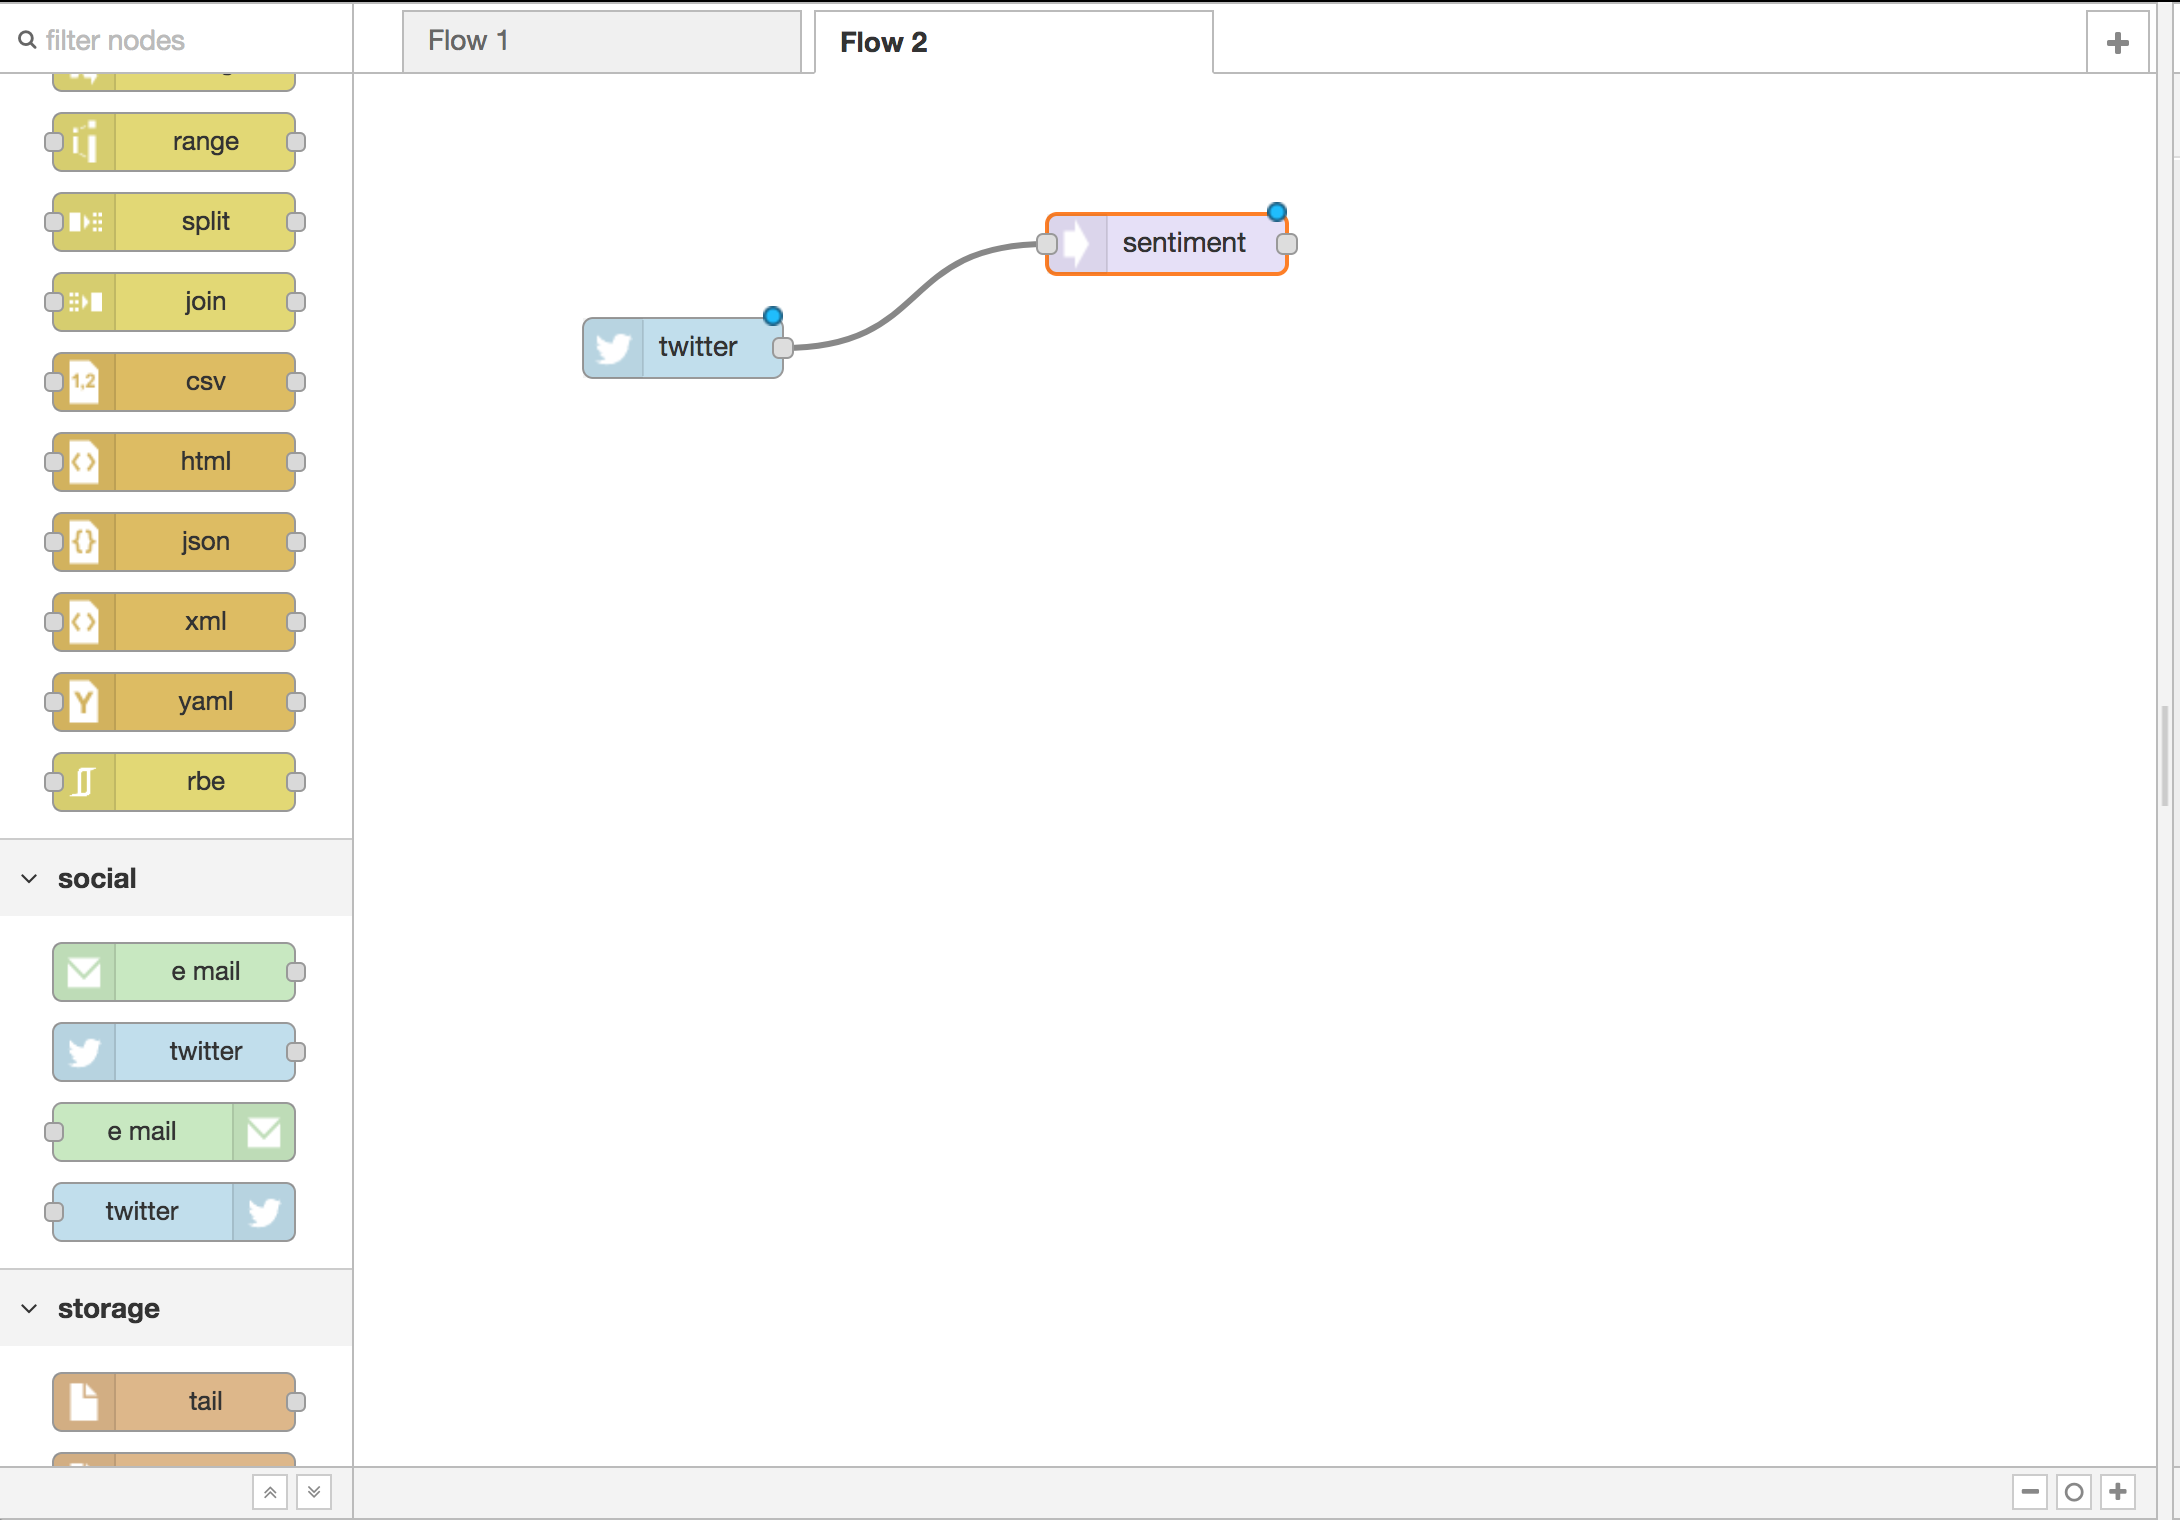
Getting twitter data is great, but we should think about doing some analysis on the data. Lets uses the “sentiment” node to get the sentiment of each tweet.
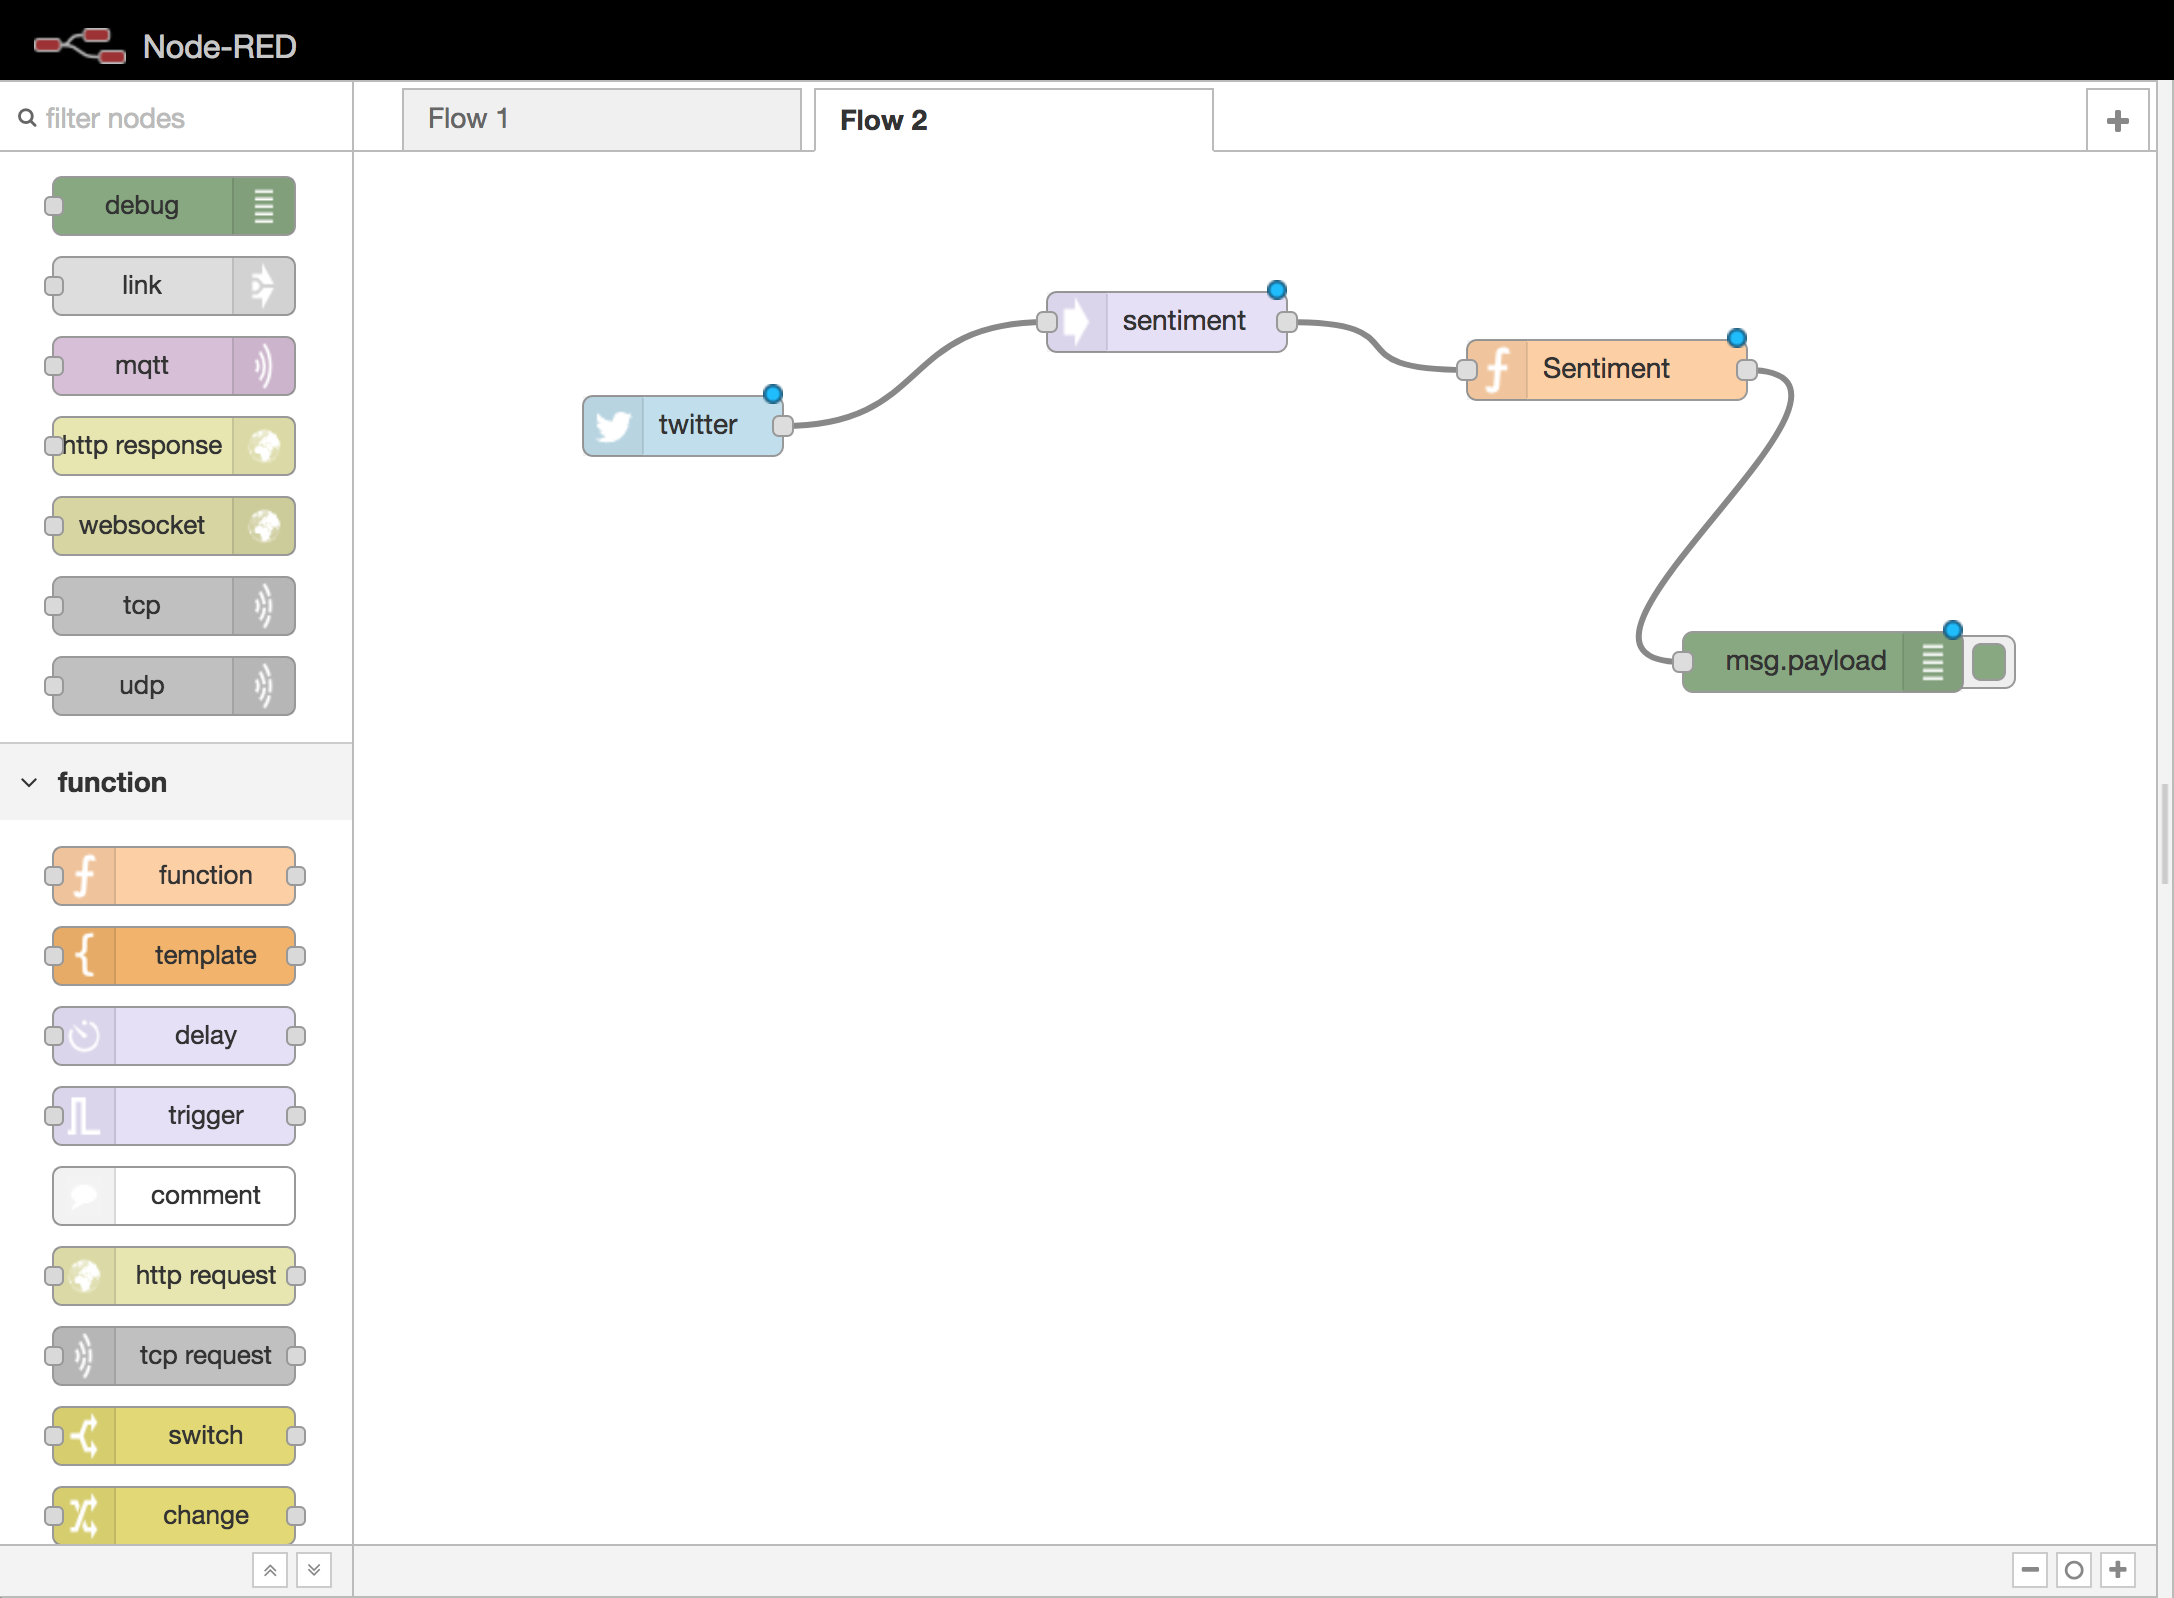
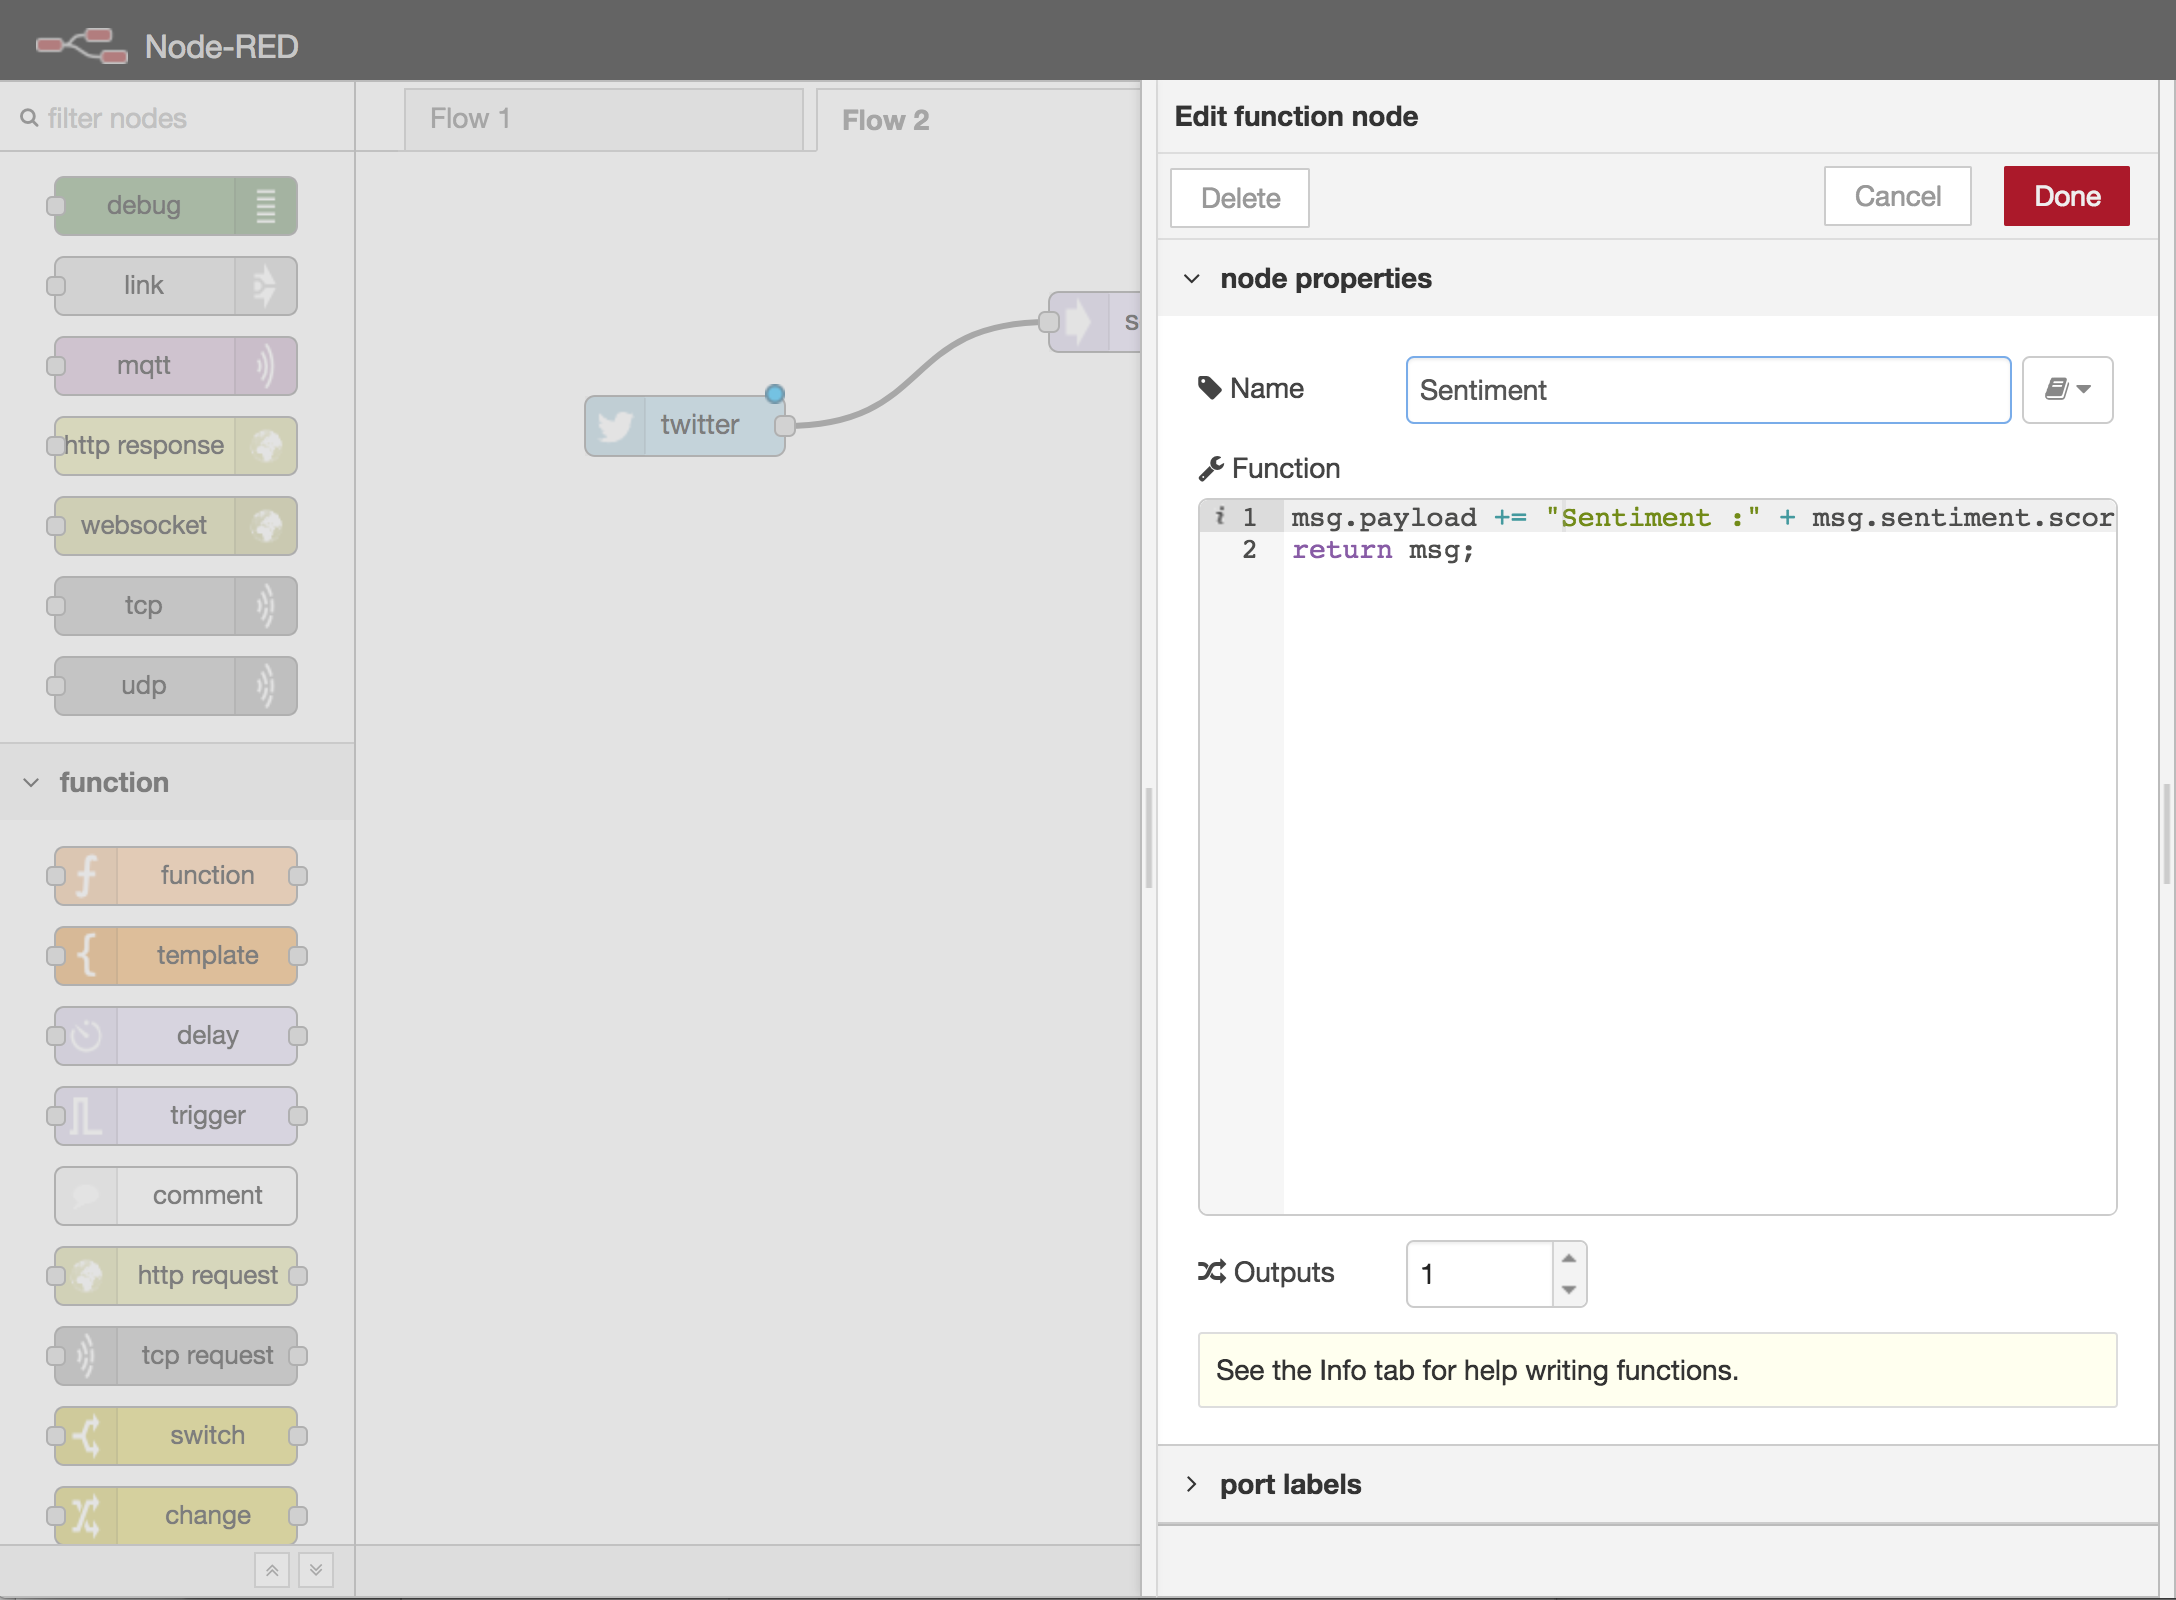
We can deploy our script now, but we wont really be able to see anything. We’ll have to use some other nodes to see the tweets in our interface. Let’s first use the “function” node. This allows us to write custom javascript. Double lick the function node to see write in the side panel.
Here, we’ll take the array of tweets with their sentiment scores and concatinate the strings together, so that each tweet has its sentiment score beside it.
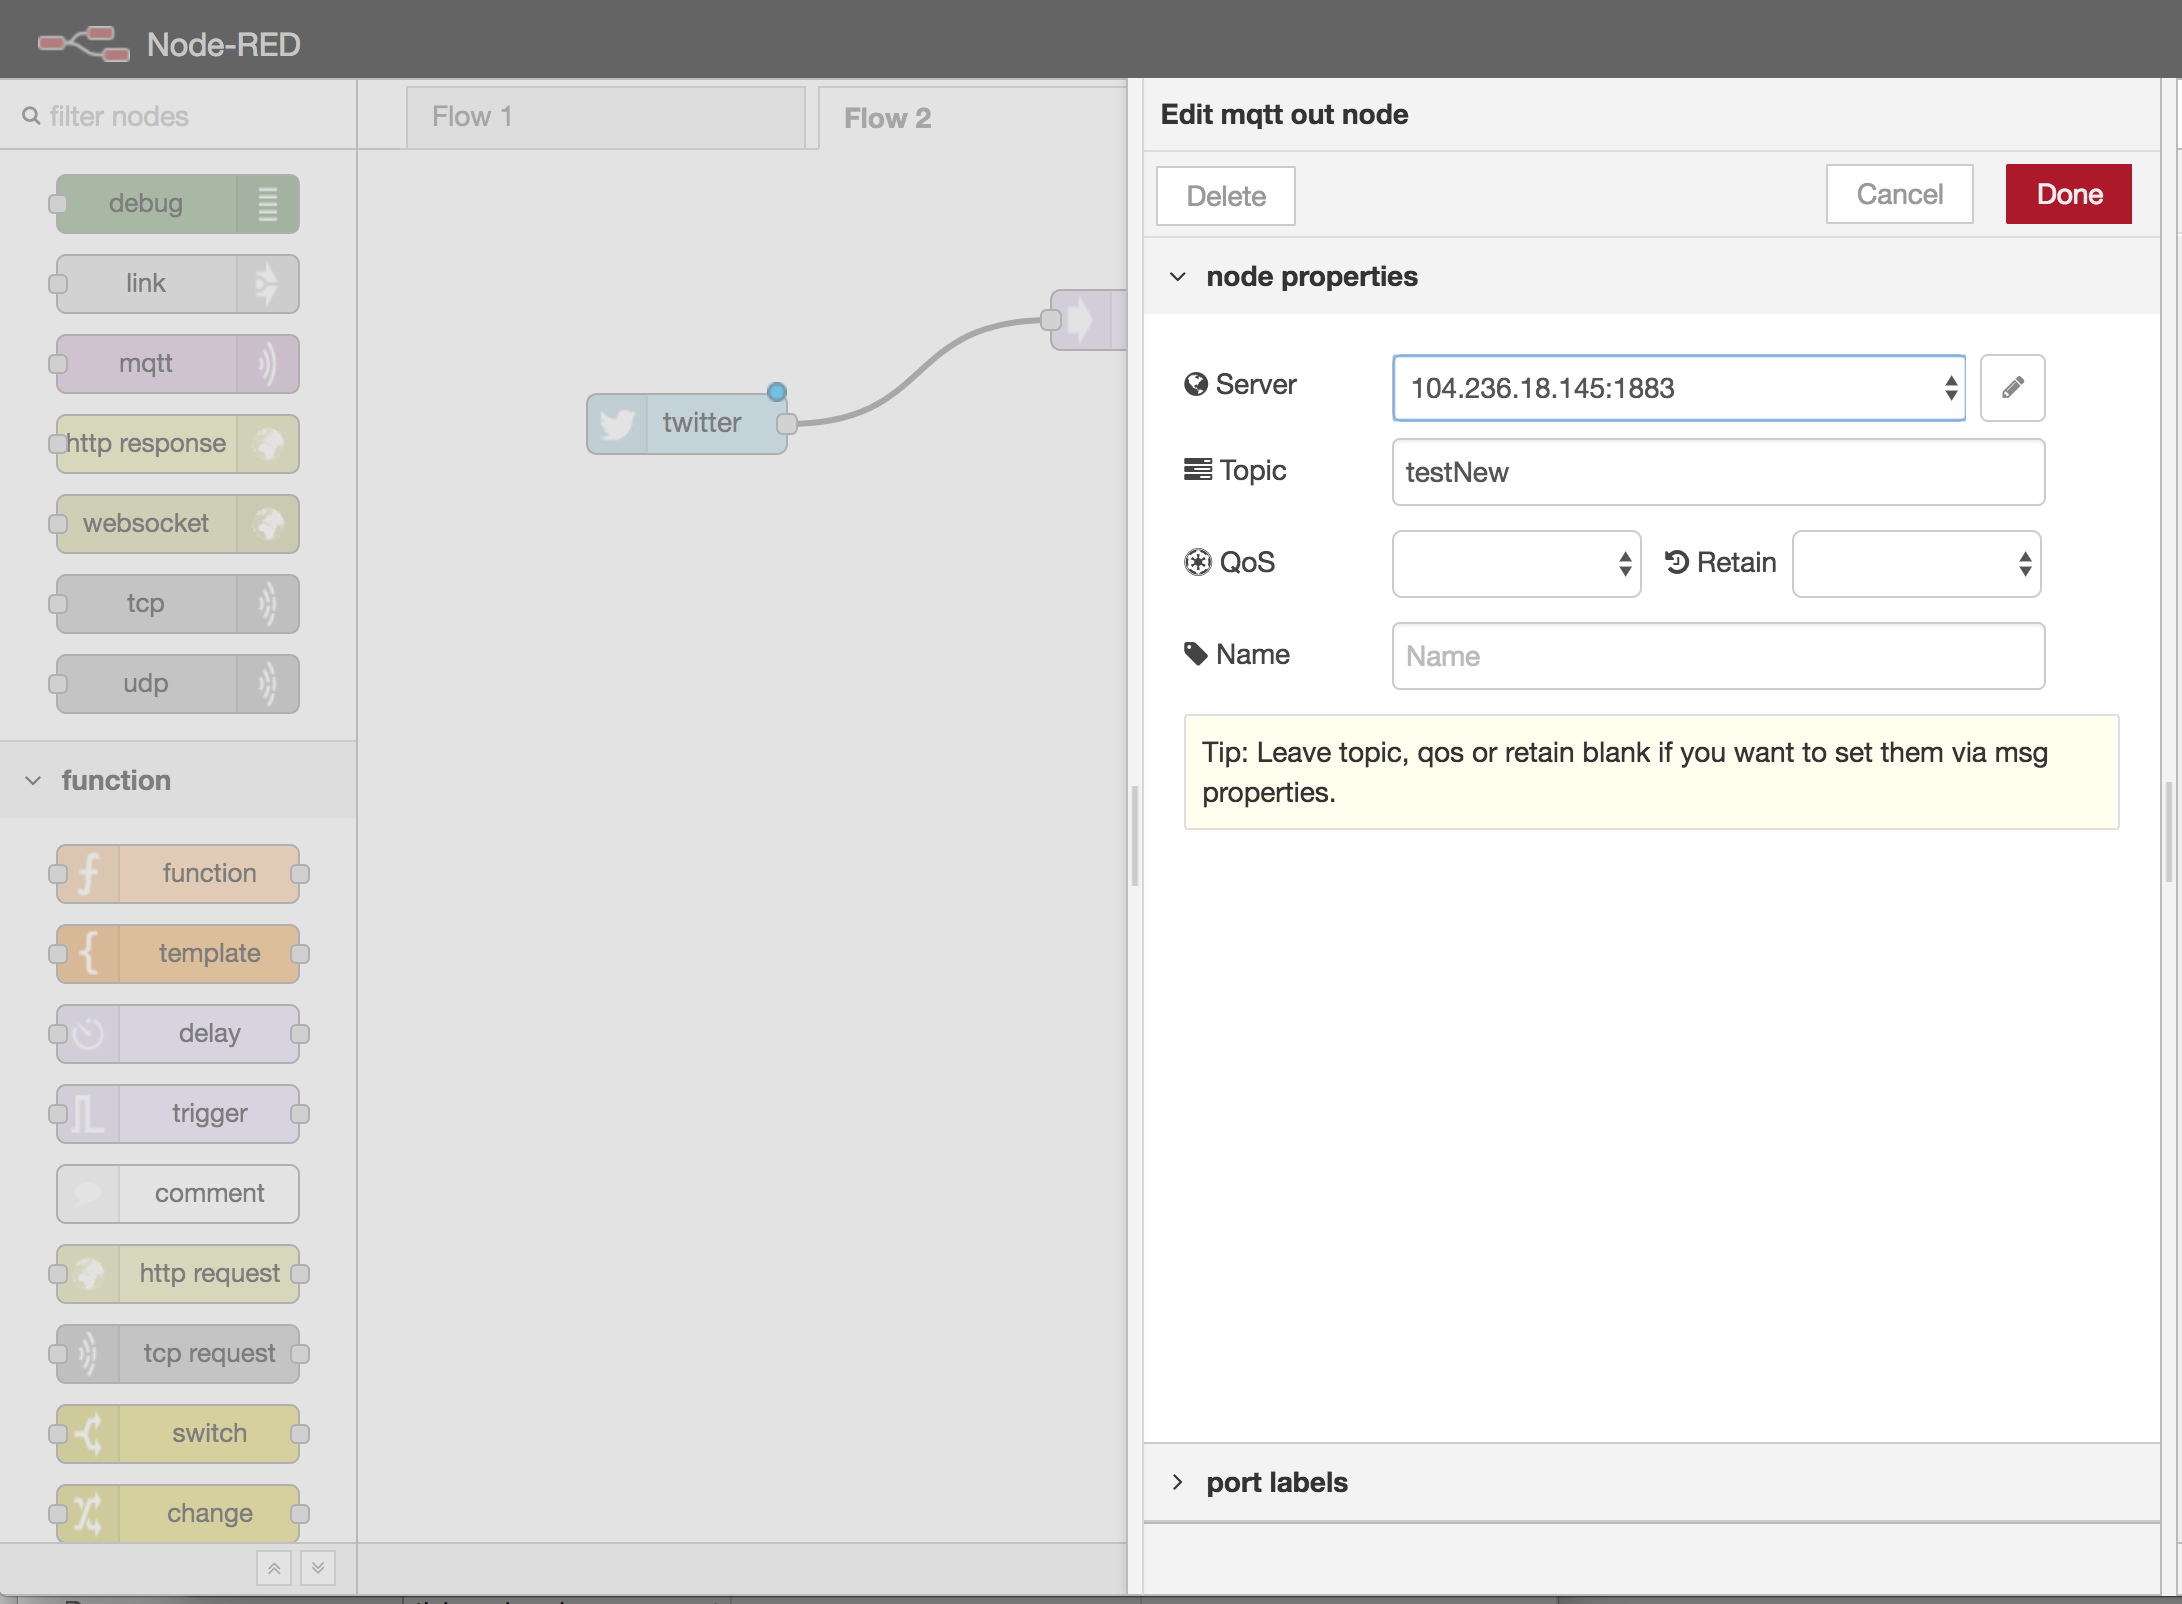
Next, lets use mqtt to allow us to send the tweets to whatever other devices we’d like. Drag in the mqtt output node and double lick it to configure. Here we can use a mqtt server that I’ve set up for the class. We can connect to the mqtt server by sending our messages to ip address 104.236.18.145 running on port 1883. We’ll also have to give our messages a topic. Here, I’ll call my topic “testNew”
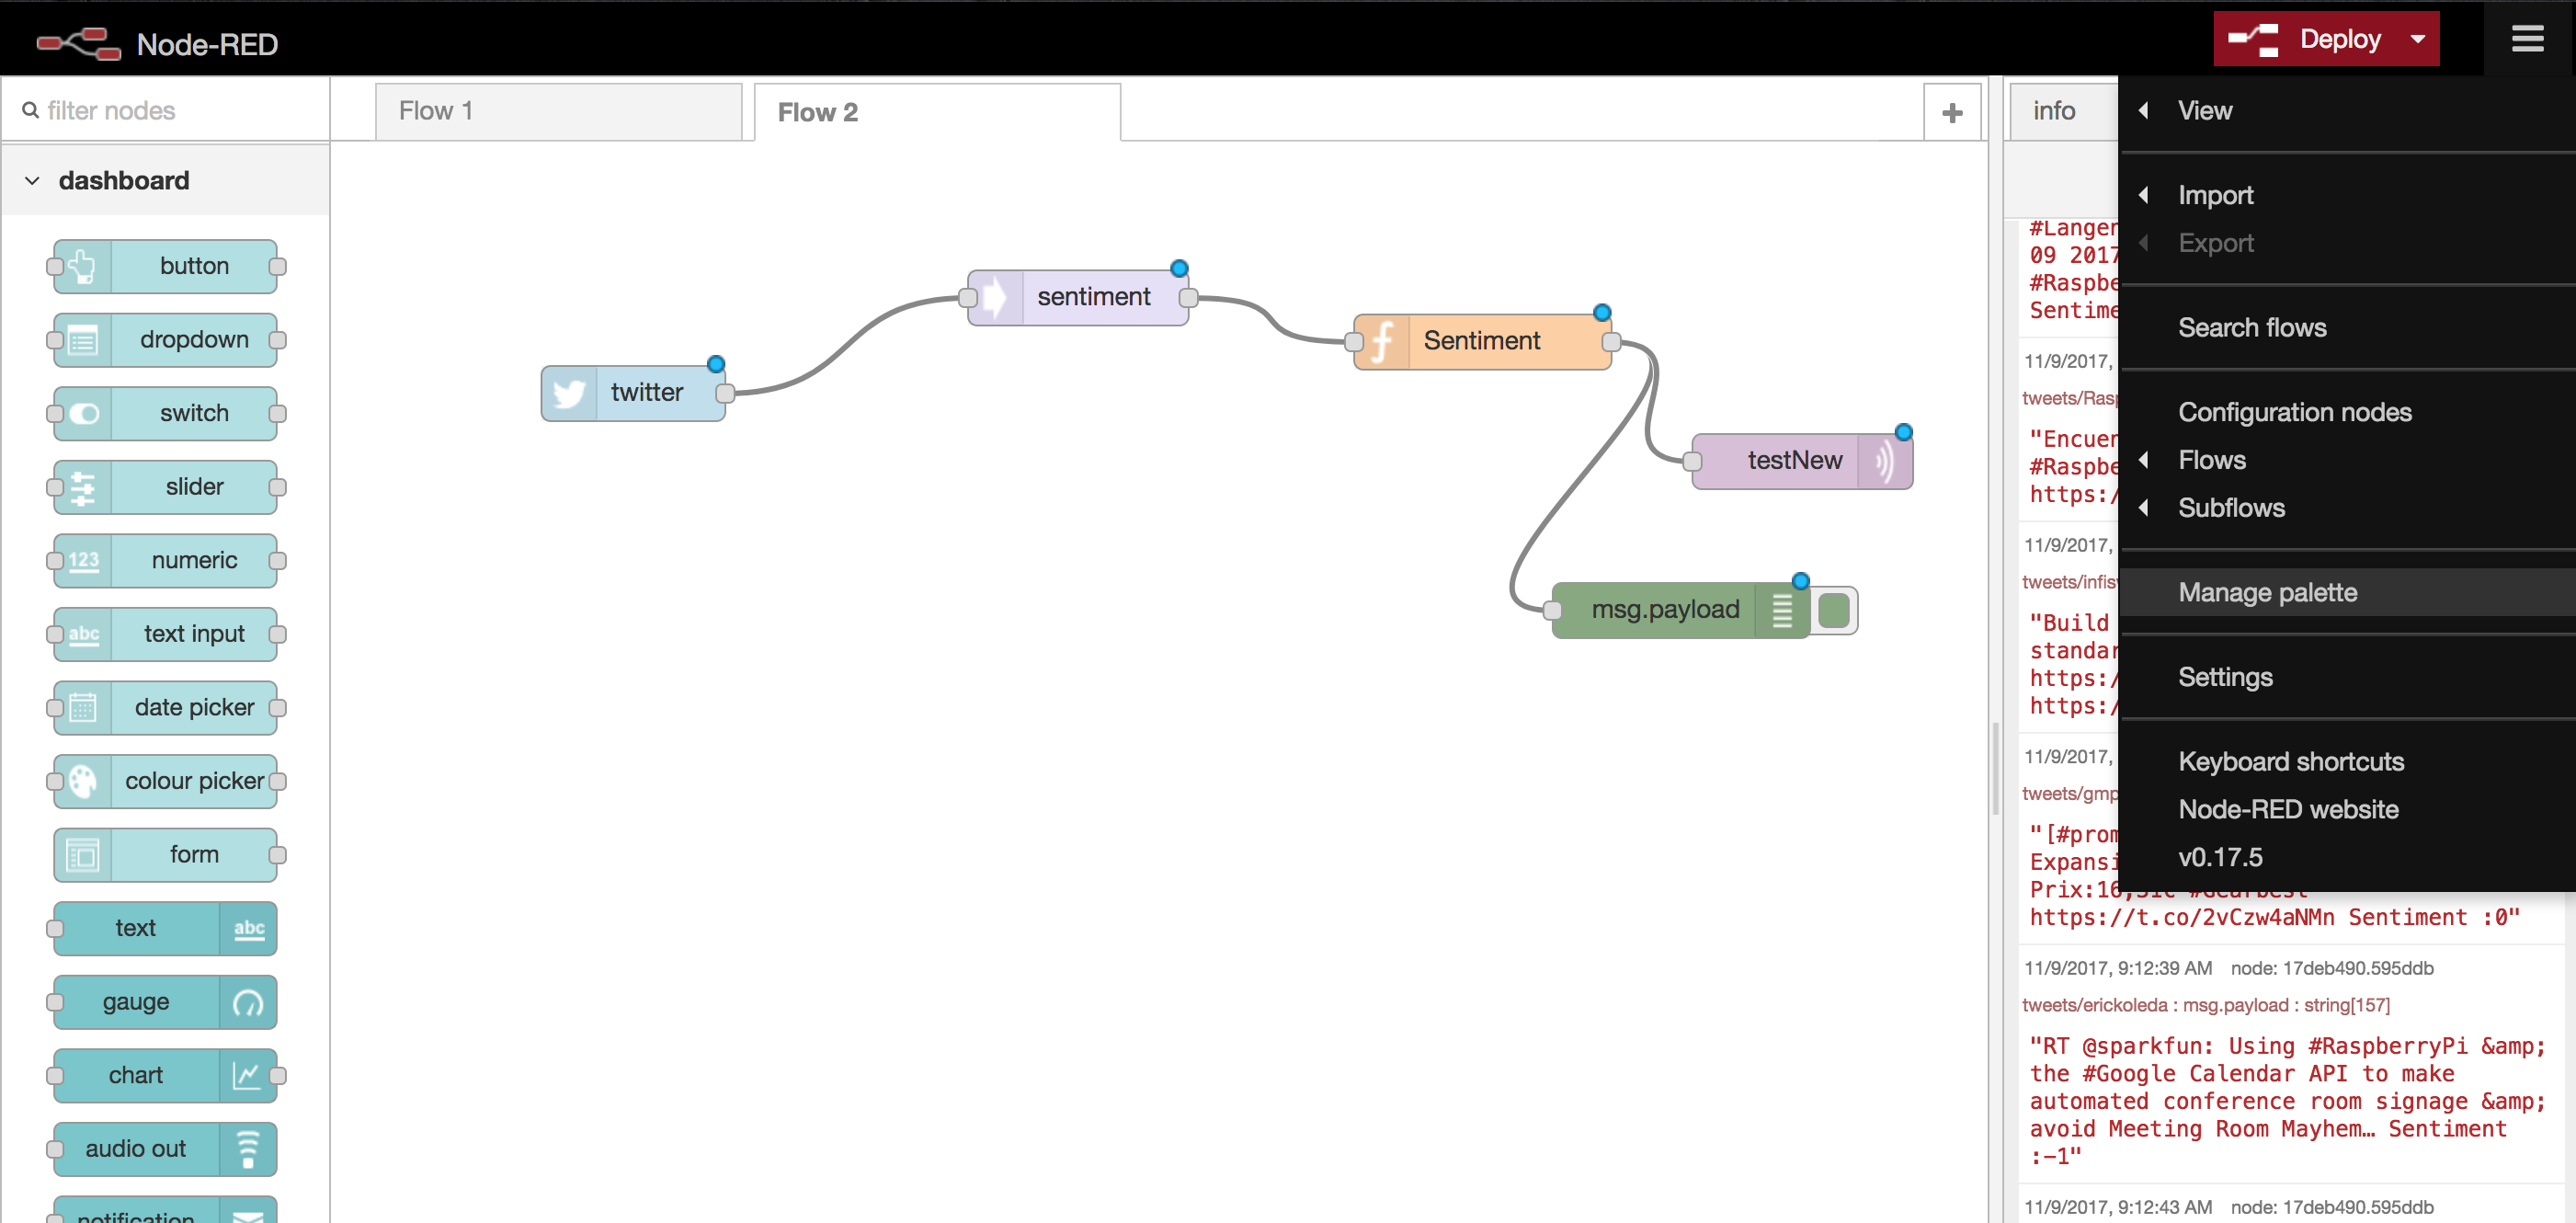
Lastly, instead of using thisp janky side panel, let’s set a little “website” dashboard of sorts to make it look a little bit nicer. On the right side of the interface, from the dropdown menu, select Manage Pallets.
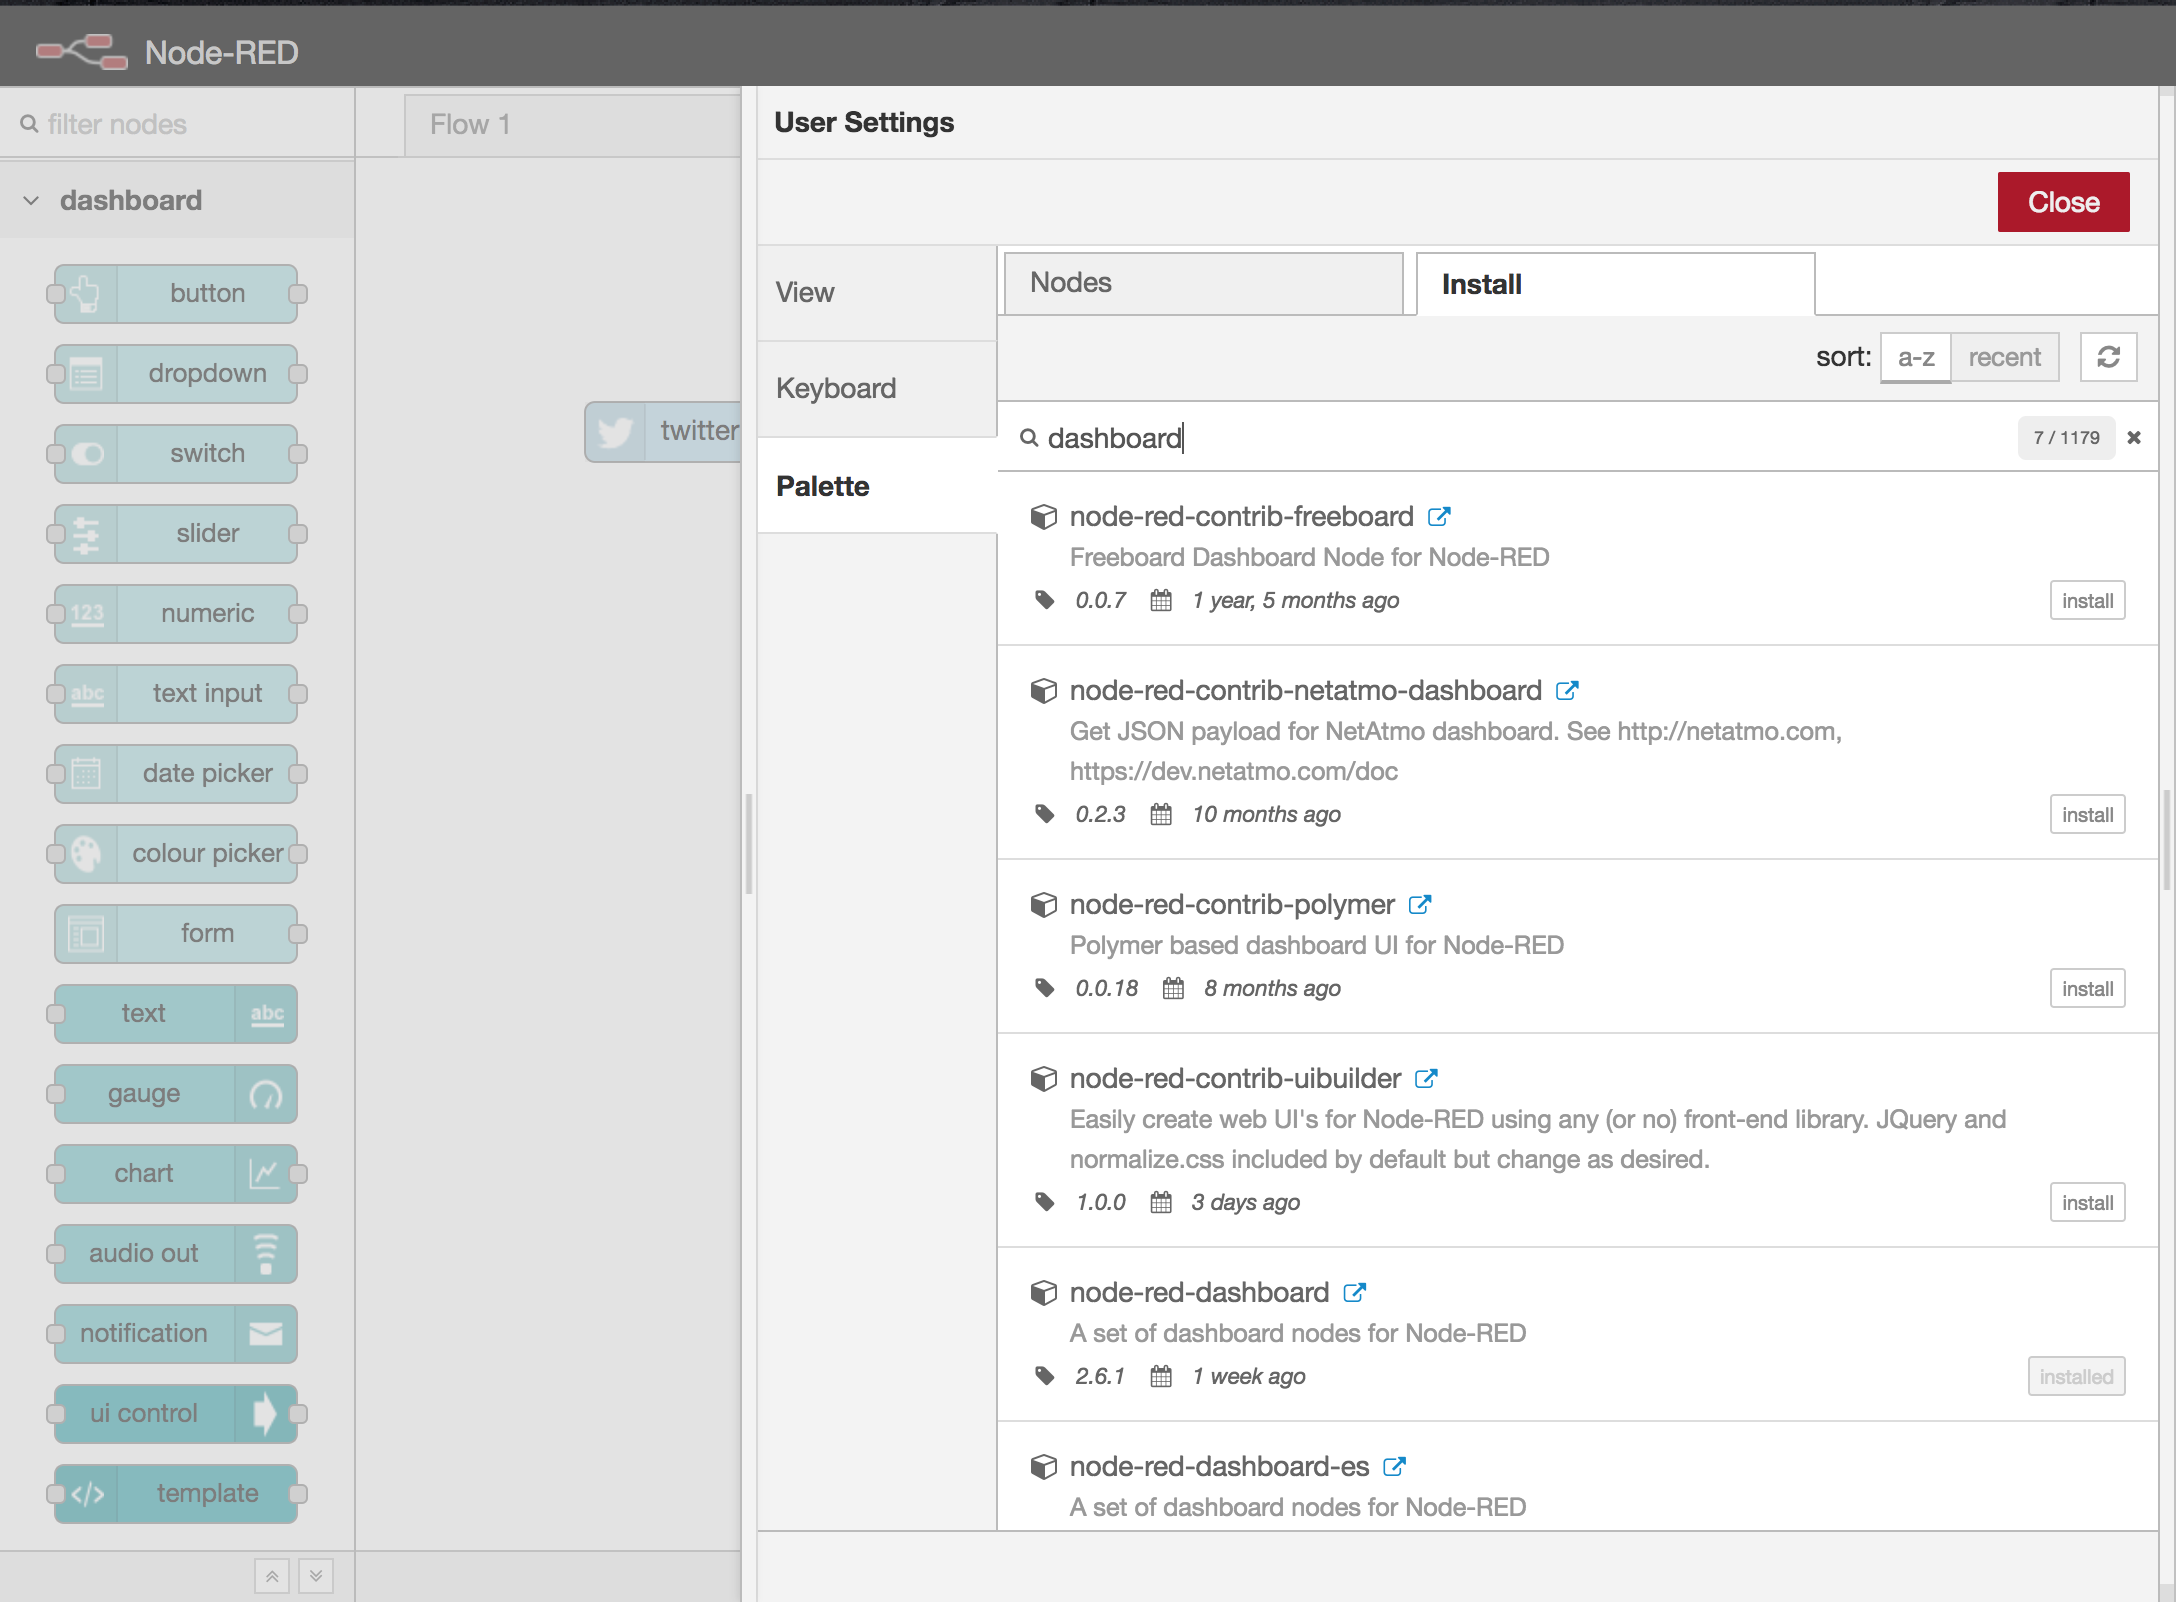
Go to the “install” tab, and we’ll install some new nodes with “node-red-dashboard”. Click install.
You should see a handful of nodes on the left side of the interface under “dashbord”

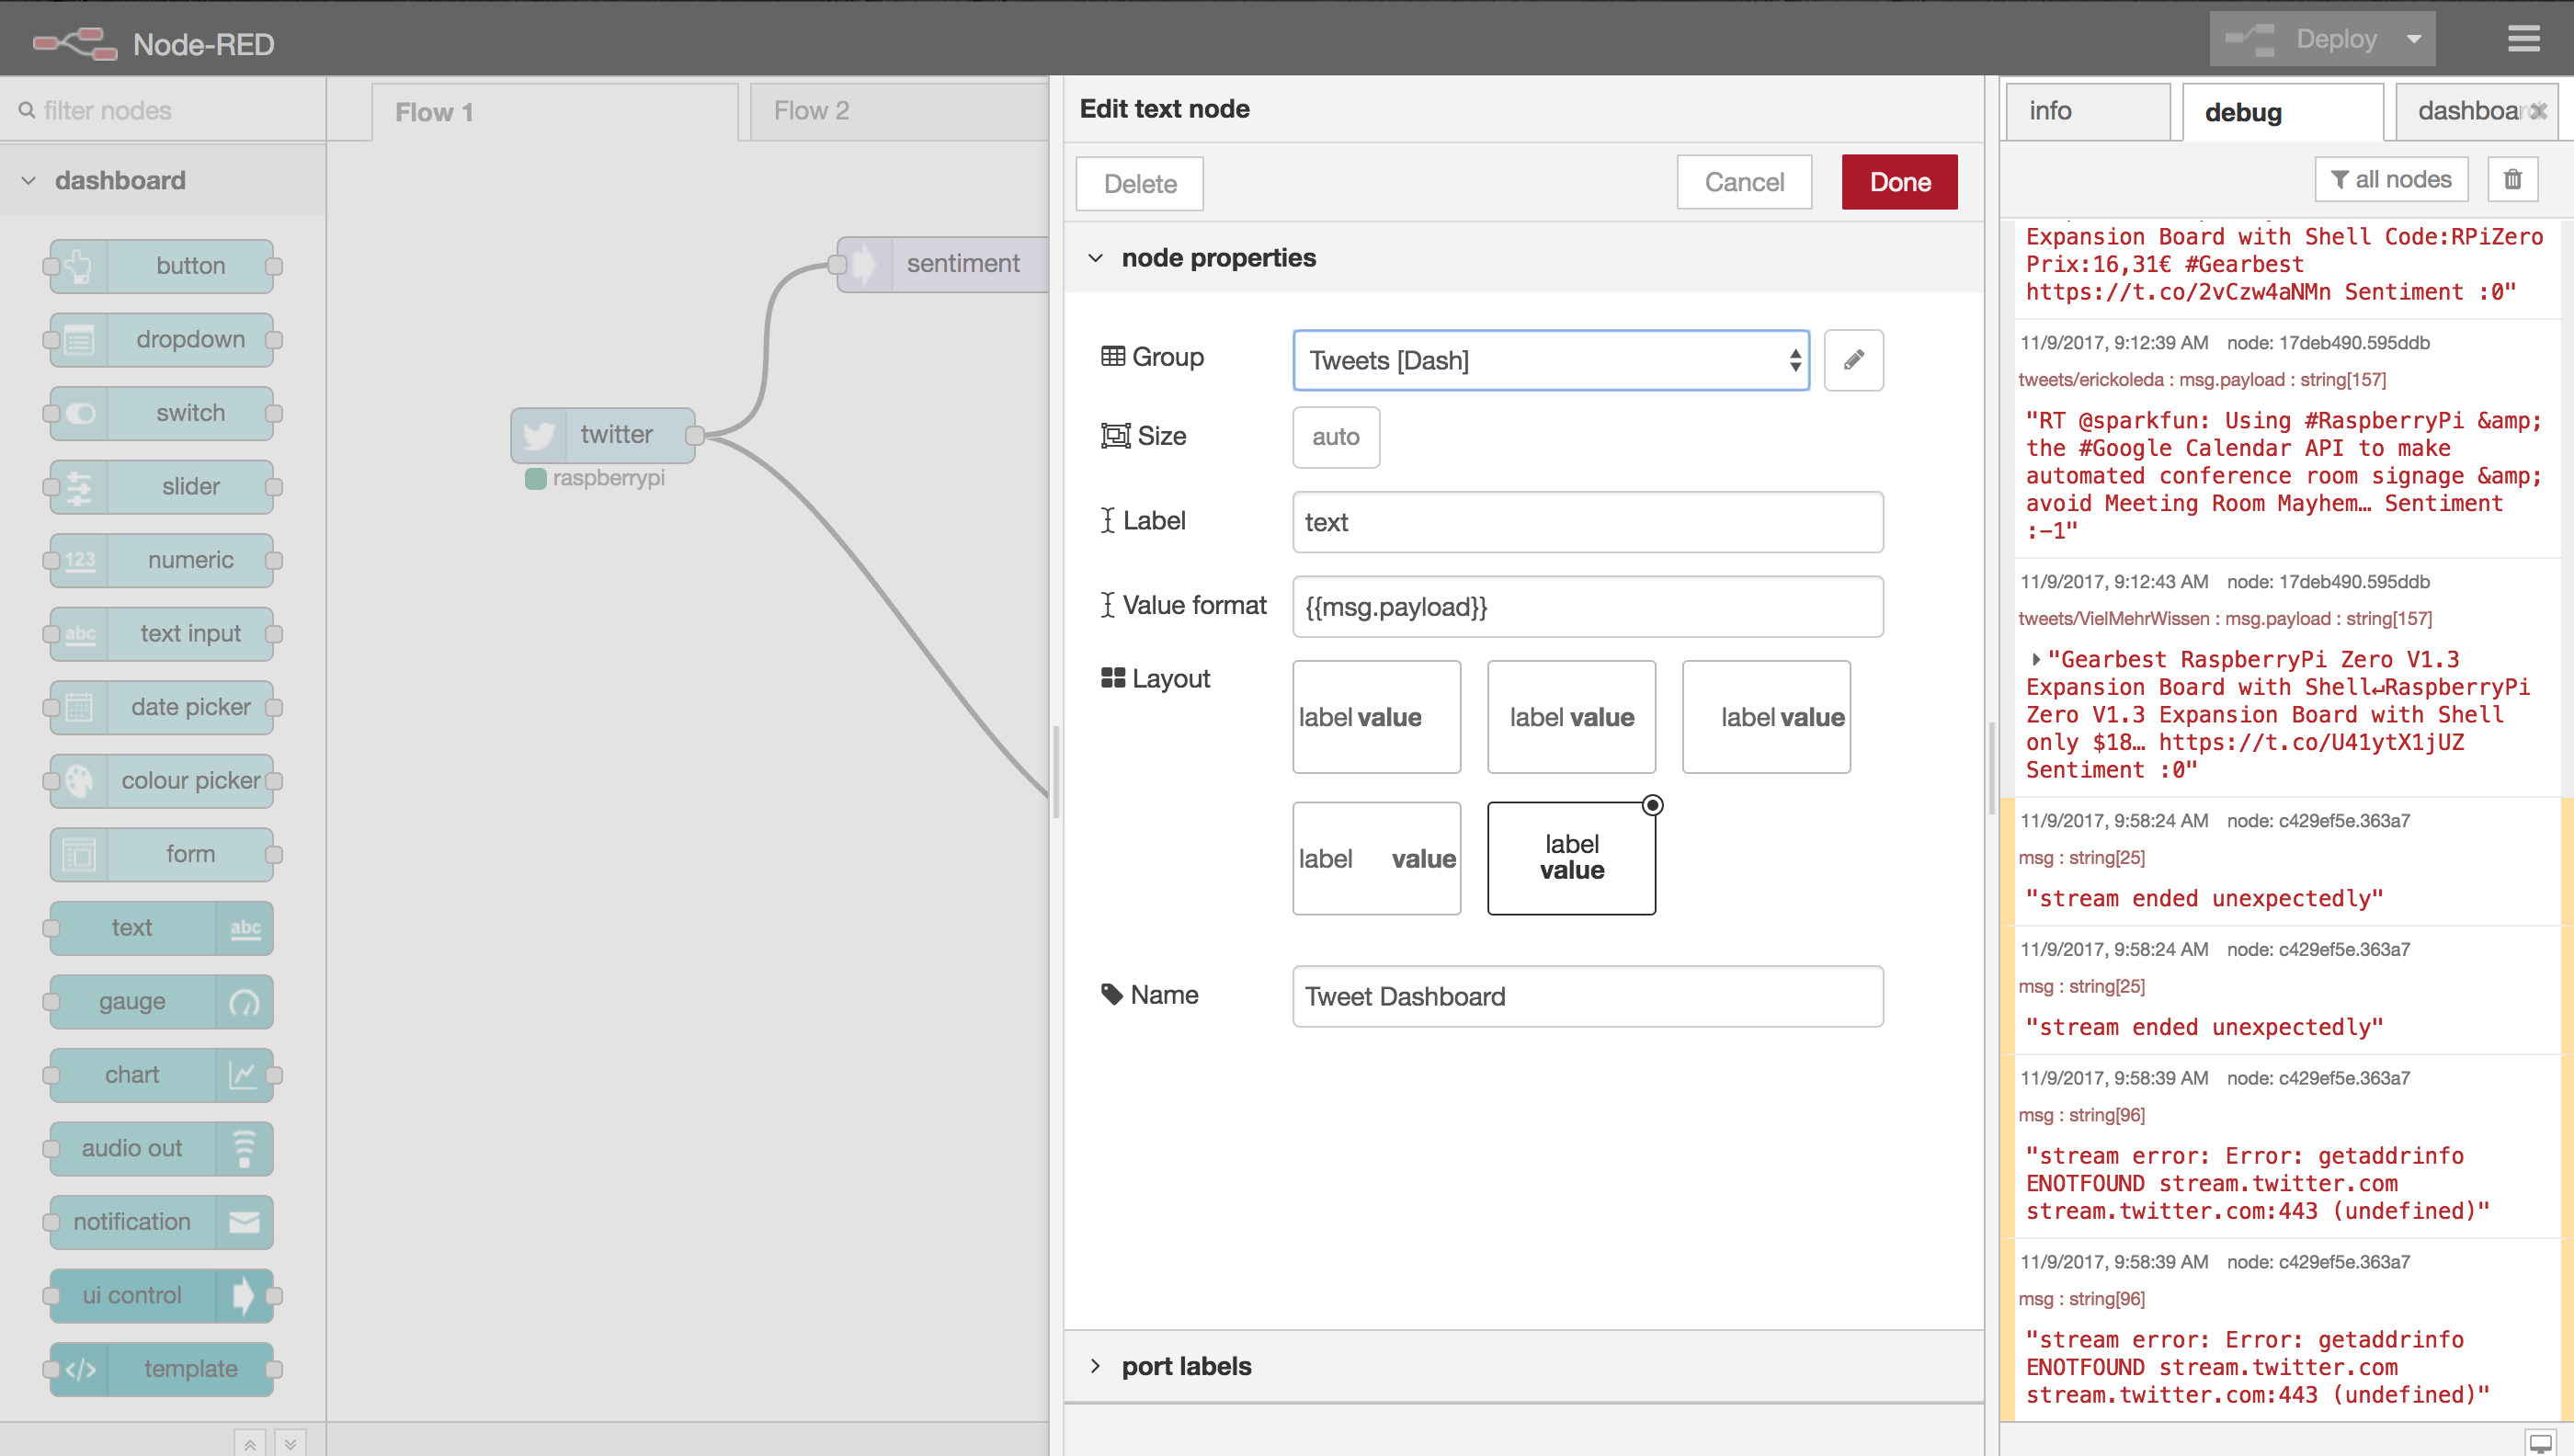
Let’s use the “text” node under dashboard to display our tweets. Double click the text node to configure. On the far side panel, under the dashboard tab, under “layout”, add a new tab by clicking “+ tab”. We’ll call it “Dash”. We’ll also have to add a group, by clicking “+ tab” again. We’ll call our group “Tweets”
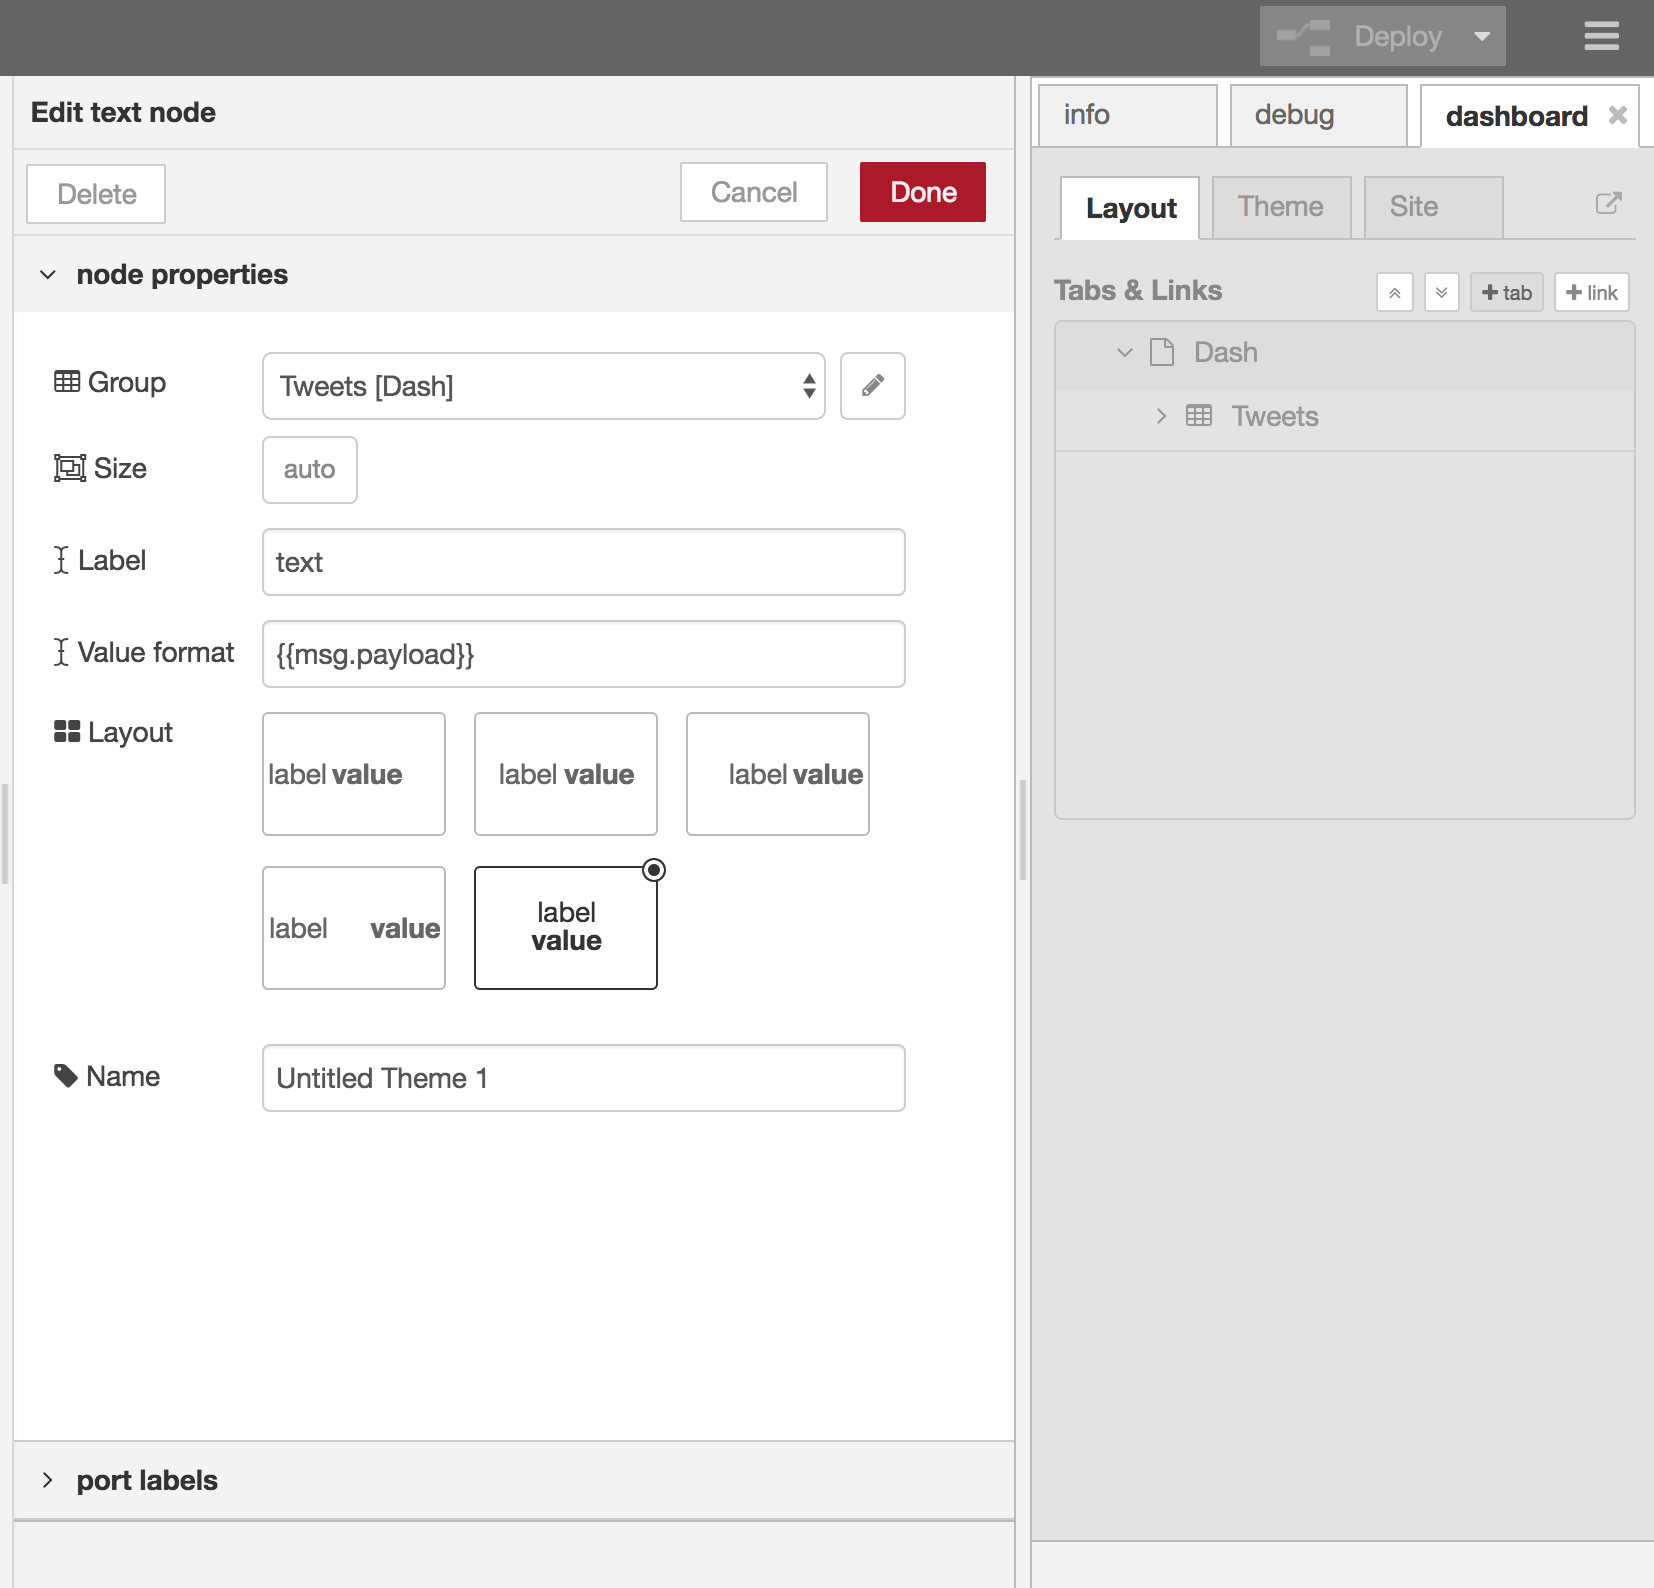
Now, inside the node properties, pick the group that we just made, and give it a name. We’ll call it Tweets Dashboard.
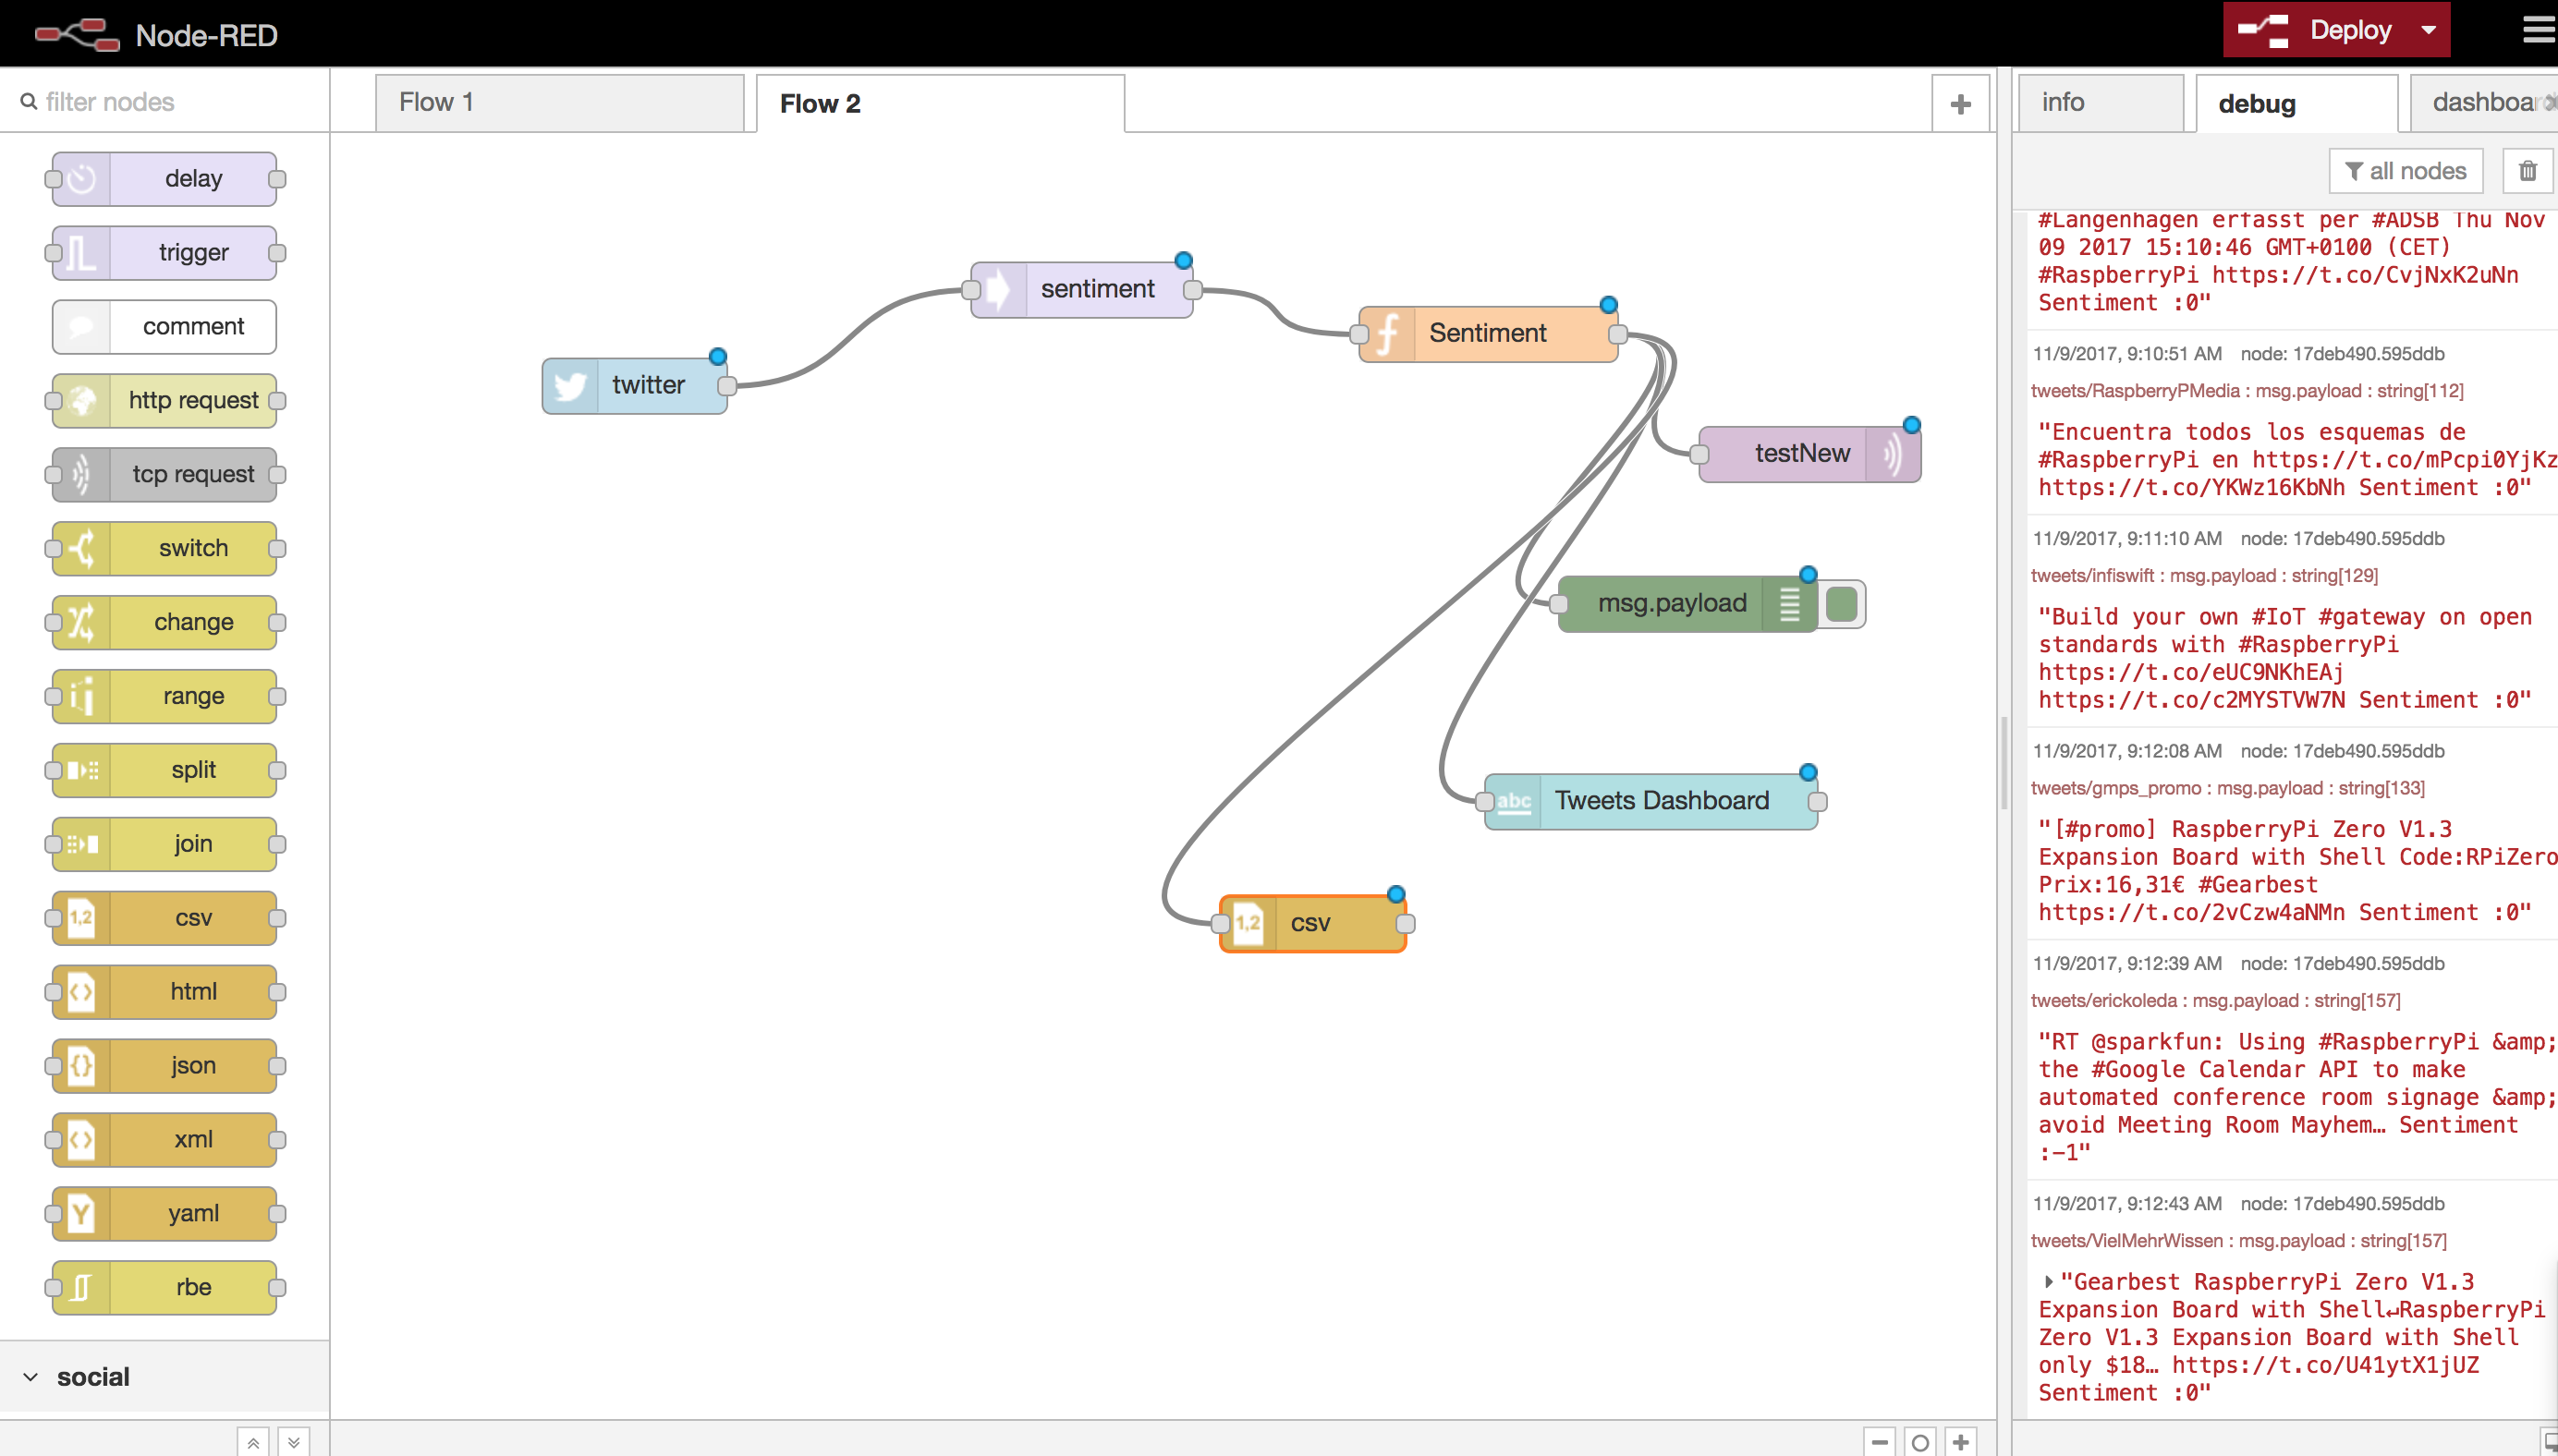
Your final script should look something like this:
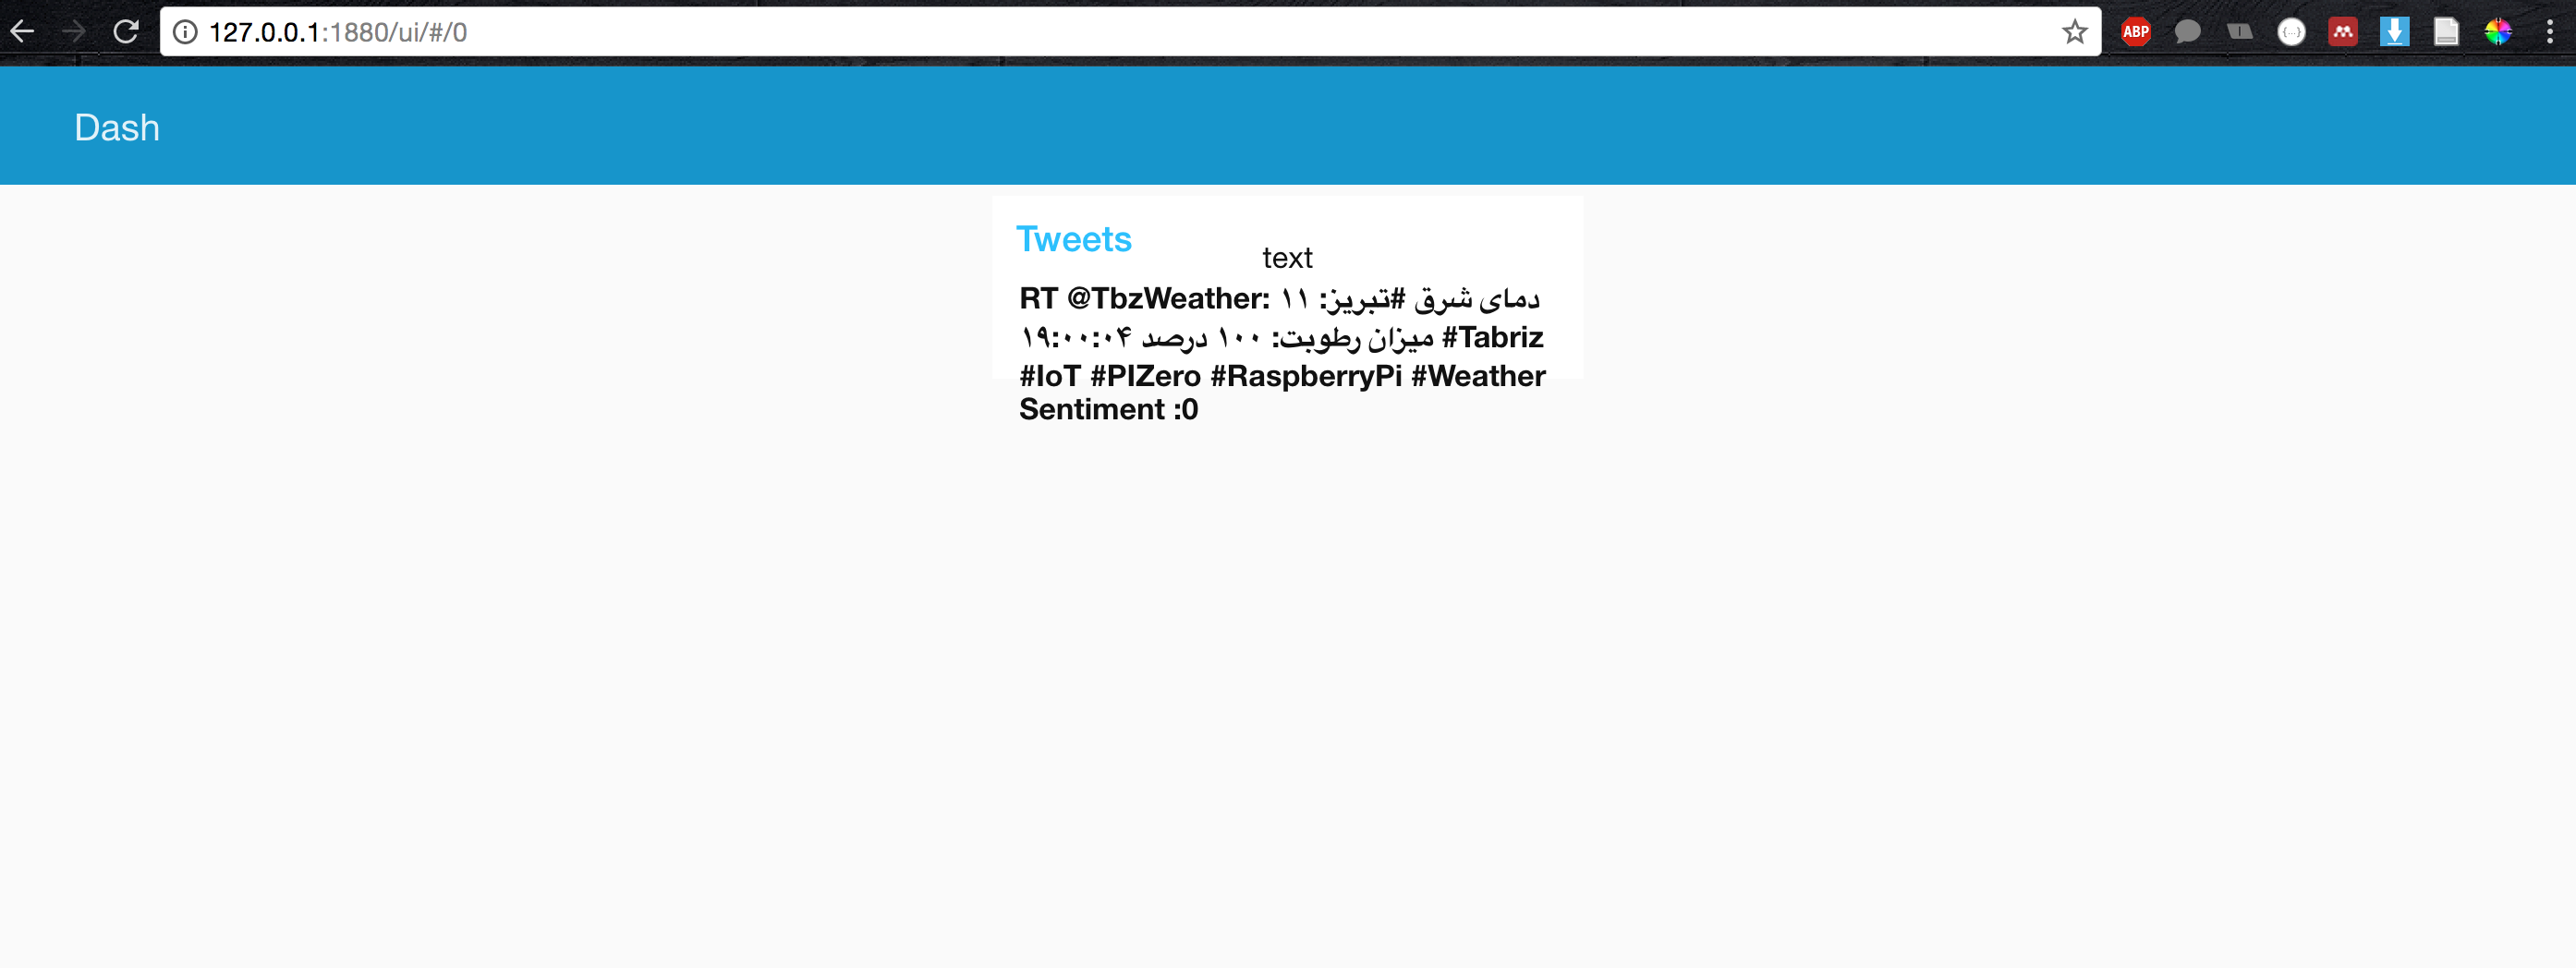
Navigate to ‘http://127.0.0.1:1880/ui/#/0’ to see the tweets that we’re taking in, along with thier sentiments, on our new dashboard
